
Technical Analysis Hub
Analyze price action, candlestick patterns, support and resistance, trend structures, and multi-timeframe confirmation.
68 learning resources across 3 surfaces
Featured Guide

Structured Lessons
Lesson
The Four Prices Inside One Candle
Lesson
Change the Timeframe, Change the Conclusion
Lesson
Trend, Range, and Noise
Lesson
Support and Resistance Aren't a Magic Line
Lesson
Trendlines: Traps and Truths
Lesson
Classic Patterns and Breakout Signals
Lesson
Multi-Timeframe: Big Picture for Trend, Small for Entry
Lesson
Moving Average and Indicator Lag Traps
Lesson
False Breakouts and Liquidity Traps
Lesson
The Boundaries of Automated Pattern Recognition
Key Concepts & Terms
Glossary
What Is OHLC? Open, High, Low, Close in One Candle
Glossary
What Is a Candlestick Body? Net Displacement Explained
Glossary
What Is a Candlestick Wick? Traces of Rejected Territory
Glossary
What Is Support in Trading? Why It Is a Zone, Not a Line
Glossary
What Is Resistance in Trading? Ceilings Are Zones Too
Glossary
What Is a Retest? Why Broken Levels Matter Again
Glossary
What Is a Higher Timeframe? The Chart That Provides Context
Glossary
What Is a Lower Timeframe? The Chart That Times the Entry
Glossary
What Is Confluence in Trading? Why Agreement Is Context, Not Certainty
Glossary
What Is Pattern Recognition in Trading? How Shape-Matching Rules Work
Glossary
What Is a False Positive in Trading? Noise That Matches the Rule
Glossary
What Is a Timeframe? The Resolution of Your Price Chart
Glossary
What Is Intraday Trading? Same-Day Positions, No Overnight Hold
Glossary
What Is Swing Trading? Riding Moves That Take Days to Weeks
Glossary
What Is a Trendline? A Subjective Ruler on an Objective Price Path
Glossary
What Is Log Scale? The Chart Setting That Measures Percentage Moves
Glossary
What Is a Price Channel? A Trendline and Its Parallel Twin
Glossary
What Is a Moving Average? A Smoothed Portrait of Recent Prices
Glossary
What Is RSI? A Momentum Gauge, Not a Reversal Button
Glossary
What Is a Lookback Period? The Window Behind Every Indicator Reading
Glossary
What Is Trading Volume? The Difference Between a Busy Market and a Liquid One
Glossary
What Is a Market Trend? Directional Momentum & Structure
Glossary
What Is a Trading Range? Consolidation & Equilibrium
Glossary
What Is a Market Regime? Structural Environments & Strategy Fit
Glossary
What Is a Breakout in Trading? Momentum & Level Penetration
Glossary
What Is a Continuation Pattern? Pauses Along an Existing Trend
Glossary
What Is a Reversal Pattern? Chart Signs of Trend Exhaustion
Glossary
What Is a False Breakout in Trading? Failed Breakout & Fakeout
Glossary
What Is a Bull Trap in Trading? False Upside Breakouts Explained
Glossary
What Is a Bear Trap in Trading? False Breakdown & Short Squeeze
In-Depth Articles

Market Analysis
A Confidence Score Is Not a Probability: What a Scanner's Number Actually Means

Market Analysis
Doji vs. Spinning Top: Two Small-Body Candles That Mean Different Things

Market Analysis
False Positives in Trading Signals: Why Most Flags Are Noise You Have to Filter
Market Analysis
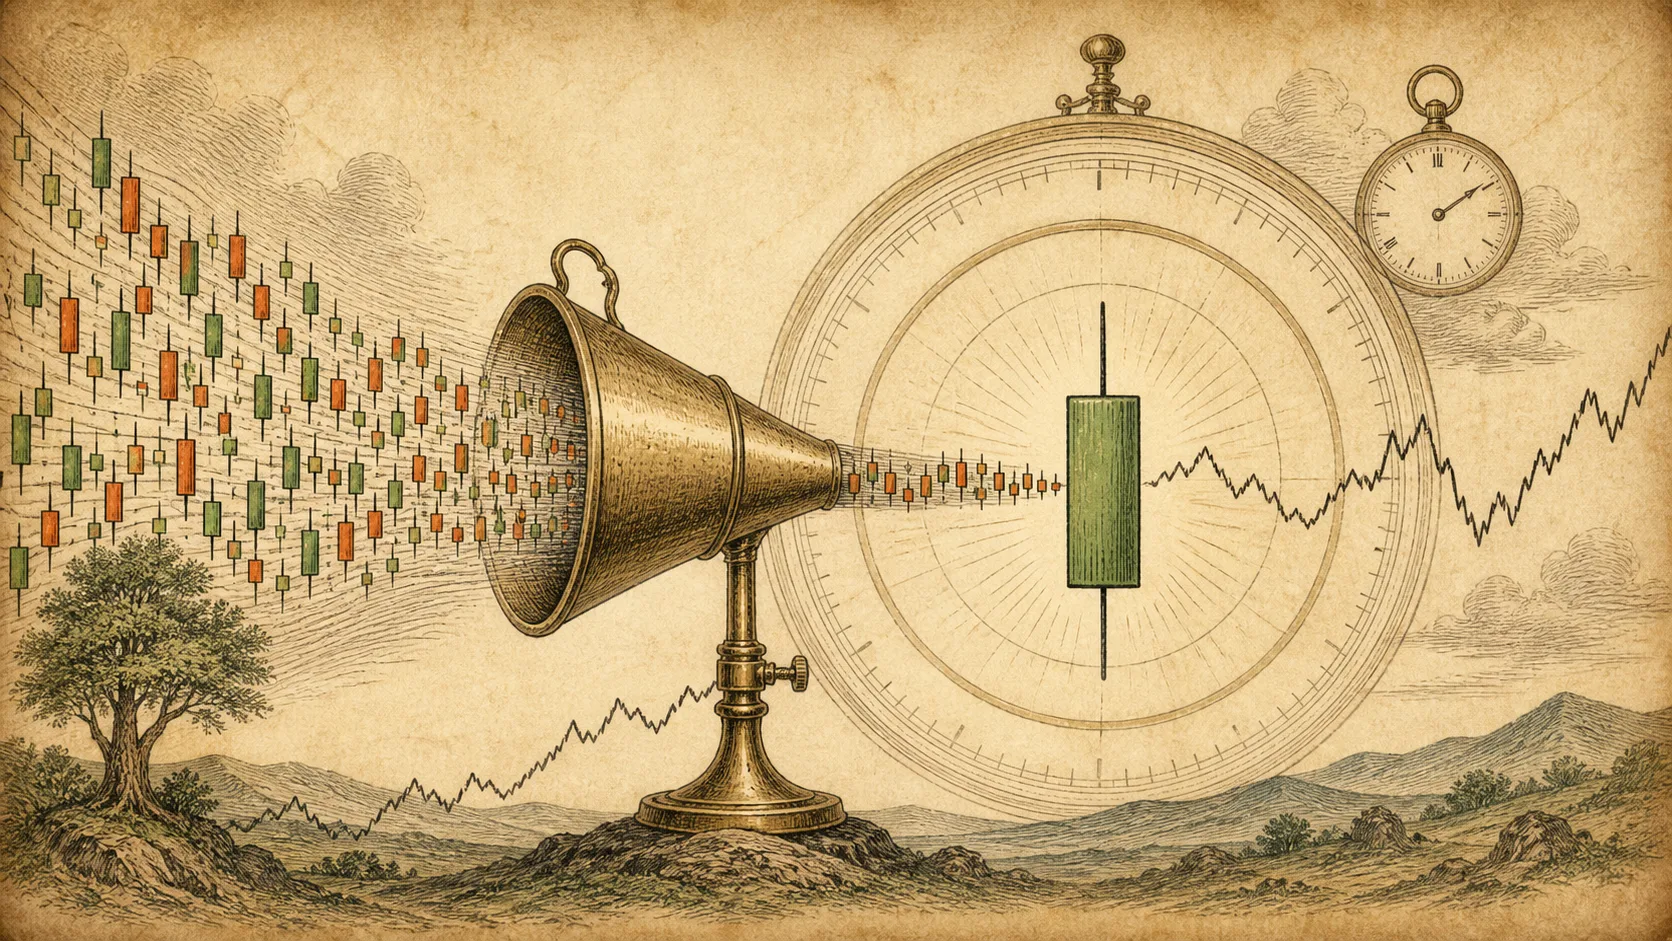
How Candles Aggregate Across Timeframes: From 5-Minute Bars to Daily Structure

Market Analysis
How Many Timeframes Should You Use? Why More Charts Are Not More Signal

Market Analysis
How to Avoid Timeframe Shopping: When Switching Charts Becomes a Rescue

Market Analysis
How to Identify Swing Highs and Lows: The Raw Material of Support and Resistance

Market Analysis
How to Mark Support and Resistance: A Practical Zone-Drawing Method

Market Analysis
Multi-Timeframe vs. Single-Timeframe Trading: What Adding a Chart Actually Buys You

Market Analysis
What Is a Doji Candle? Open Near Close, Indecision on the Chart

Market Analysis
Why Support and Resistance Levels Fail: Zones Are Probabilities, Not Walls
Market Analysis
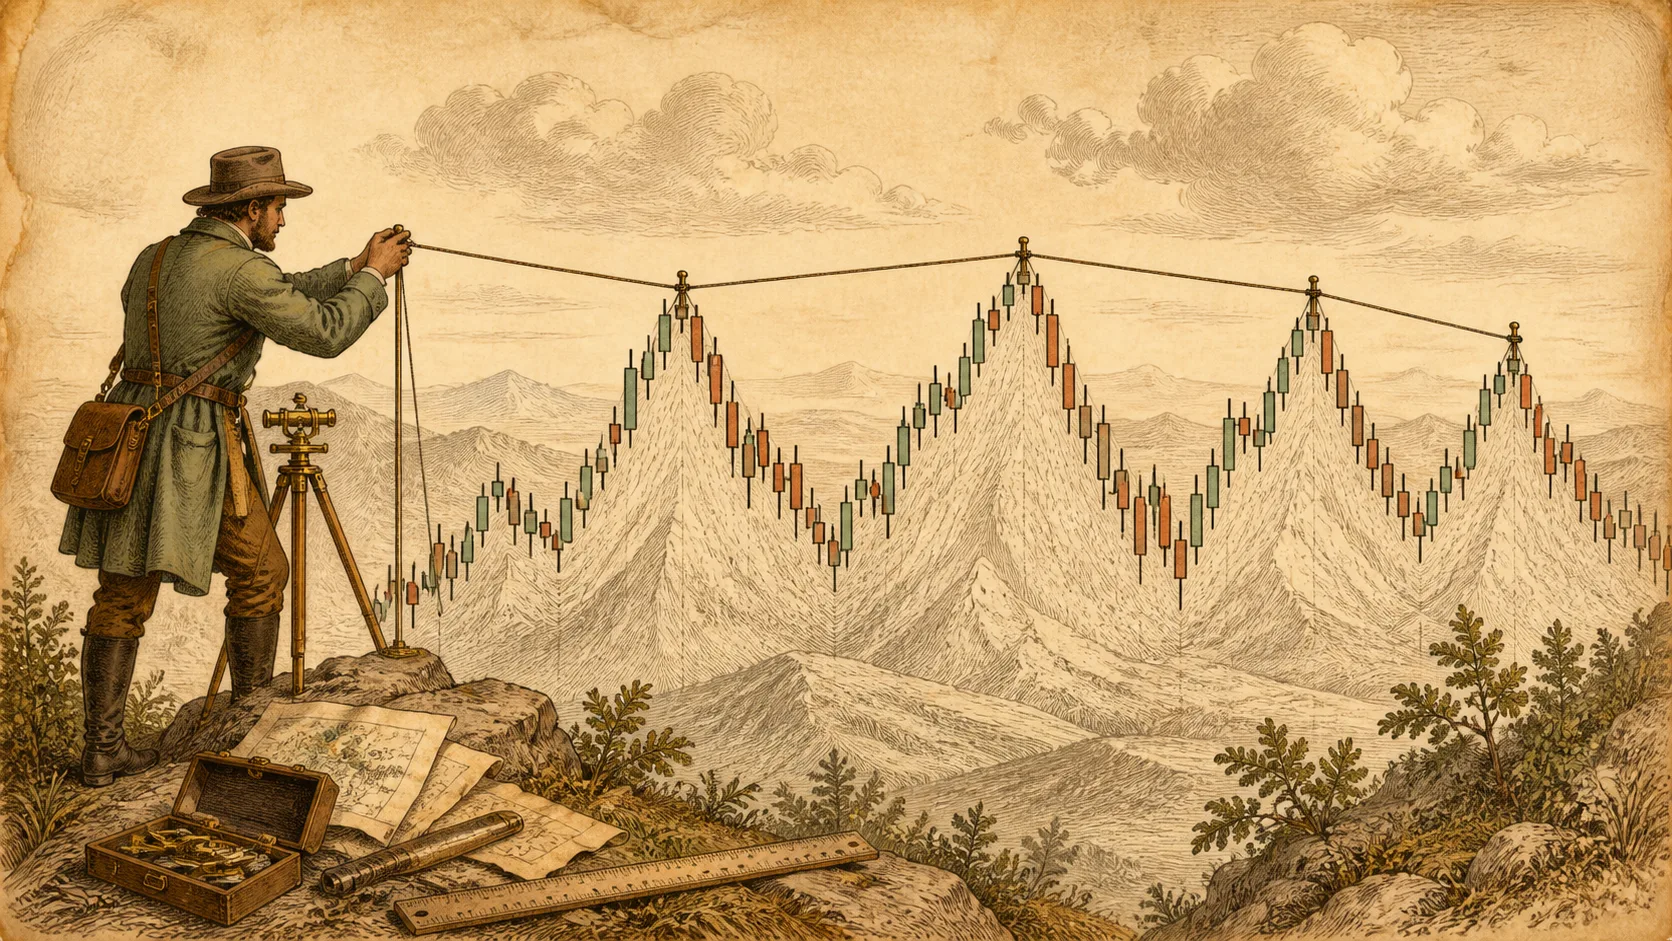
How to Draw a Trendline That Actually Means Something

Market Analysis
Indicator Overload: When More Signals Mean Less Information

Market Analysis
Intraday vs Swing Trading: Same Market, Different Jobs

Market Analysis
Leading vs Lagging Indicators: The Trade-Off Behind the Labels

Market Analysis
Logarithmic vs Linear Charts: Which Scale Is Telling the Truth?

Market Analysis
Price Channels: When Two Parallel Lines Describe a Market

Market Analysis
RSI Overbought Doesn’t Mean Sell: How Overbought and Oversold Get Misread

Market Analysis
Timeframe vs Holding Period: Pick the Chart That Matches Your Trade

Market Analysis
Why Lower Timeframes Are Harder to Trade

Market Analysis
How to Identify a Range-Bound Market Before Getting Trapped

Market Analysis
Common Chart Patterns for Beginners: Beyond Rote Memorization

Market Analysis
What Counts as Breakout Confirmation in Trading?

Market Analysis
Continuation vs Reversal Patterns: Reading Market Momentum

Market Analysis
False Breakout vs Real Breakout: How to Tell the Difference Without Guessing

Market Analysis
Bull Trap vs Bear Trap: How Liquidity Imbalances Catch Traders on Both Sides

Market Analysis