
Net distance between Open and Close
Close > Open creates a bullish (green/white) candle showing net buyer victory; Close < Open creates a bearish (red/black) candle showing net seller victory. Longer bodies reflect stronger directional displacement.
When entering technical analysis, beginners often rush into memorizing mystical patterns like "Morning Stars" or "Hanging Men". Yet all complex charts are built from the same elementary mechanism: compressing price exploration over a given time window into four numbers — Open, High, Low, and Close. Understanding the physics of these four prices prevents you from reading fairy tales into charts.
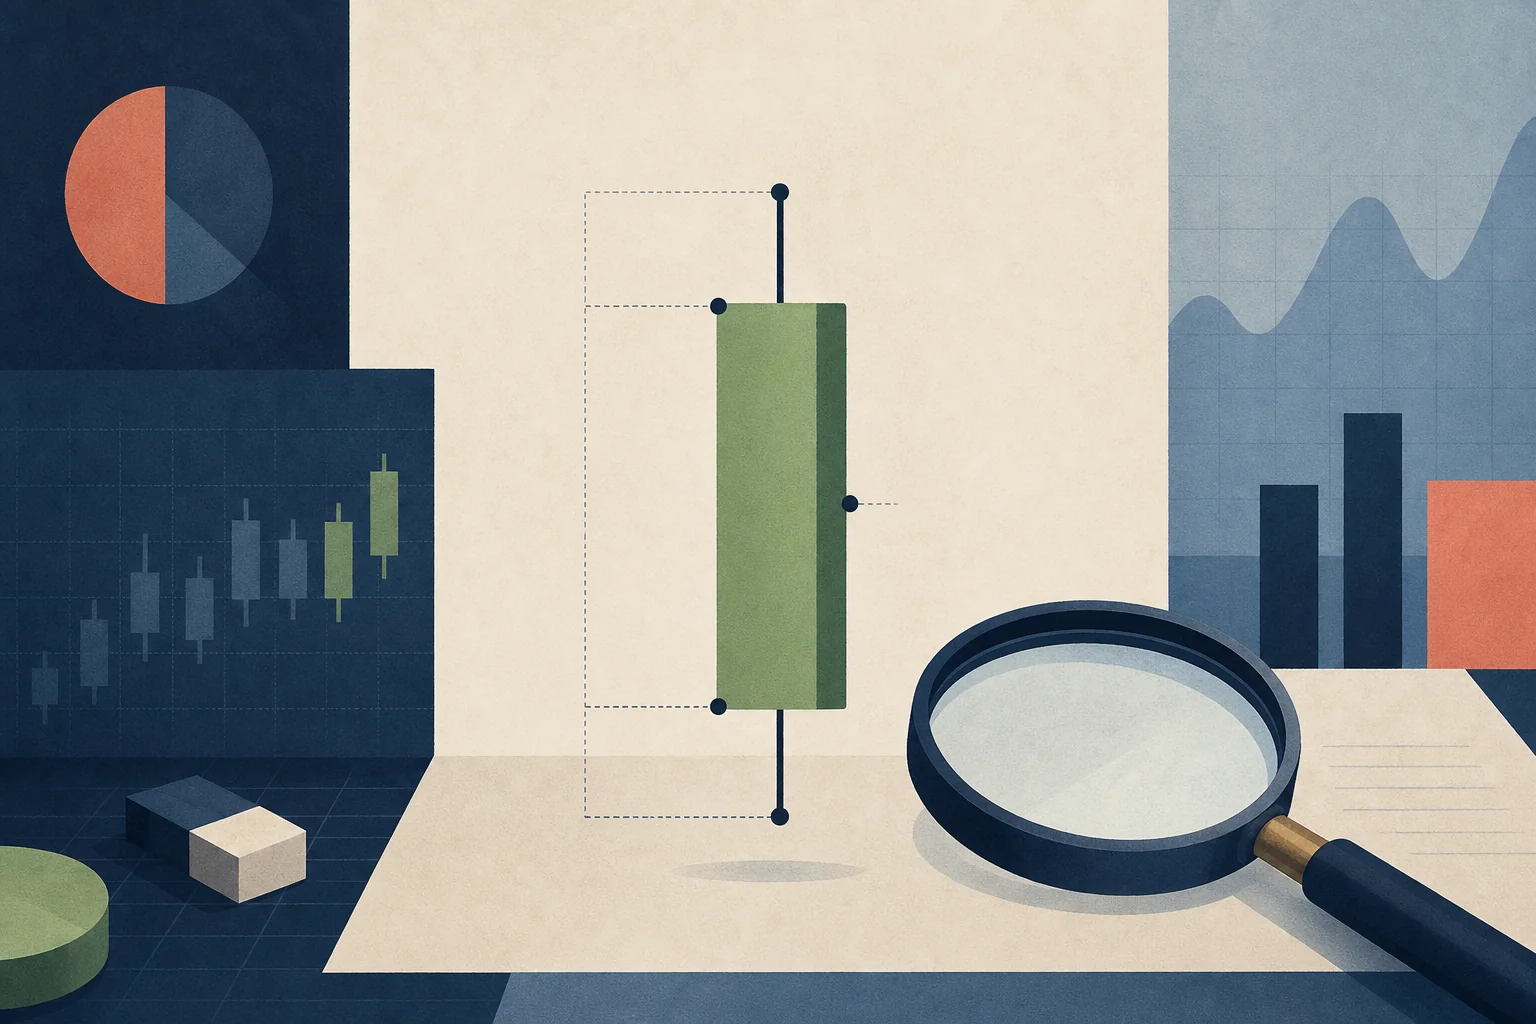
Whether you trade a 1-minute scalping chart, a 4-hour swing chart, or the daily timeframe, every single candlestick is simply a visual settlement of what happened between buyers and sellers within that fixed window:
The highest matched transaction recorded during this time window. Confirms this high was visited before price retreated to close lower.
Core insight: A candlestick is a compressed record of 4 boundary prices (OHLC). The body represents net price displacement; wicks record where price traded away from extremes. Single bars are evidence, not verdicts.
Connecting these four price points generates the candlestick's body and wicks:
Close > Open creates a bullish (green/white) candle showing net buyer victory; Close < Open creates a bearish (red/black) candle showing net seller victory. Longer bodies reflect stronger directional displacement.
Price visited the High but was forced downward before the close. Longer upper wicks reflect strong resistance and supply overhead.
Price visited the Low but was pushed back upward before the close. Longer lower wicks reflect strong demand and support below.
Consider two 1-hour candles with the exact same numbers (Open 100, High 108, Low 96, Close 103):
• Path A: Dumps to 96 immediately, rallies furiously to 108, closes at 103 (buyers staged a dominant comeback);
• Path B: Spikes to 108 immediately, gets slammed by bears down to 96, bounces weakly to 103 (buyers were trapped and crushed).
The micro-psychology of the two paths is diametrically opposed, yet their resulting candlesticks look identical!
How to use it: pick an "intraday path," then drag the "replay progress" below. Switch to the other path and compare whether the OHLC on the right stays the same.
Current price:103
This path's final OHLC is locked in.
Switch to the other path and the final OHLC stays the same — a single candle compresses away the order the extremes happened in and the ticks in between.
Open is the start, Close is the verdict, High is buyer reach, Low is seller reach.
Wicks show where price tried to go and was denied. But single wicks never guarantee trend reversal on their own.
Candlesticks are slice summaries. Reading elaborate stories into a single candle without market context is a primary source of losses.
3 fundamental mechanics questions to test your grasp of candlestick basics.
Ask Mira to break down how multiple short-term candles compose a larger timeframe candle, or how to spot genuine price rejection.
Checking sign-in status...