
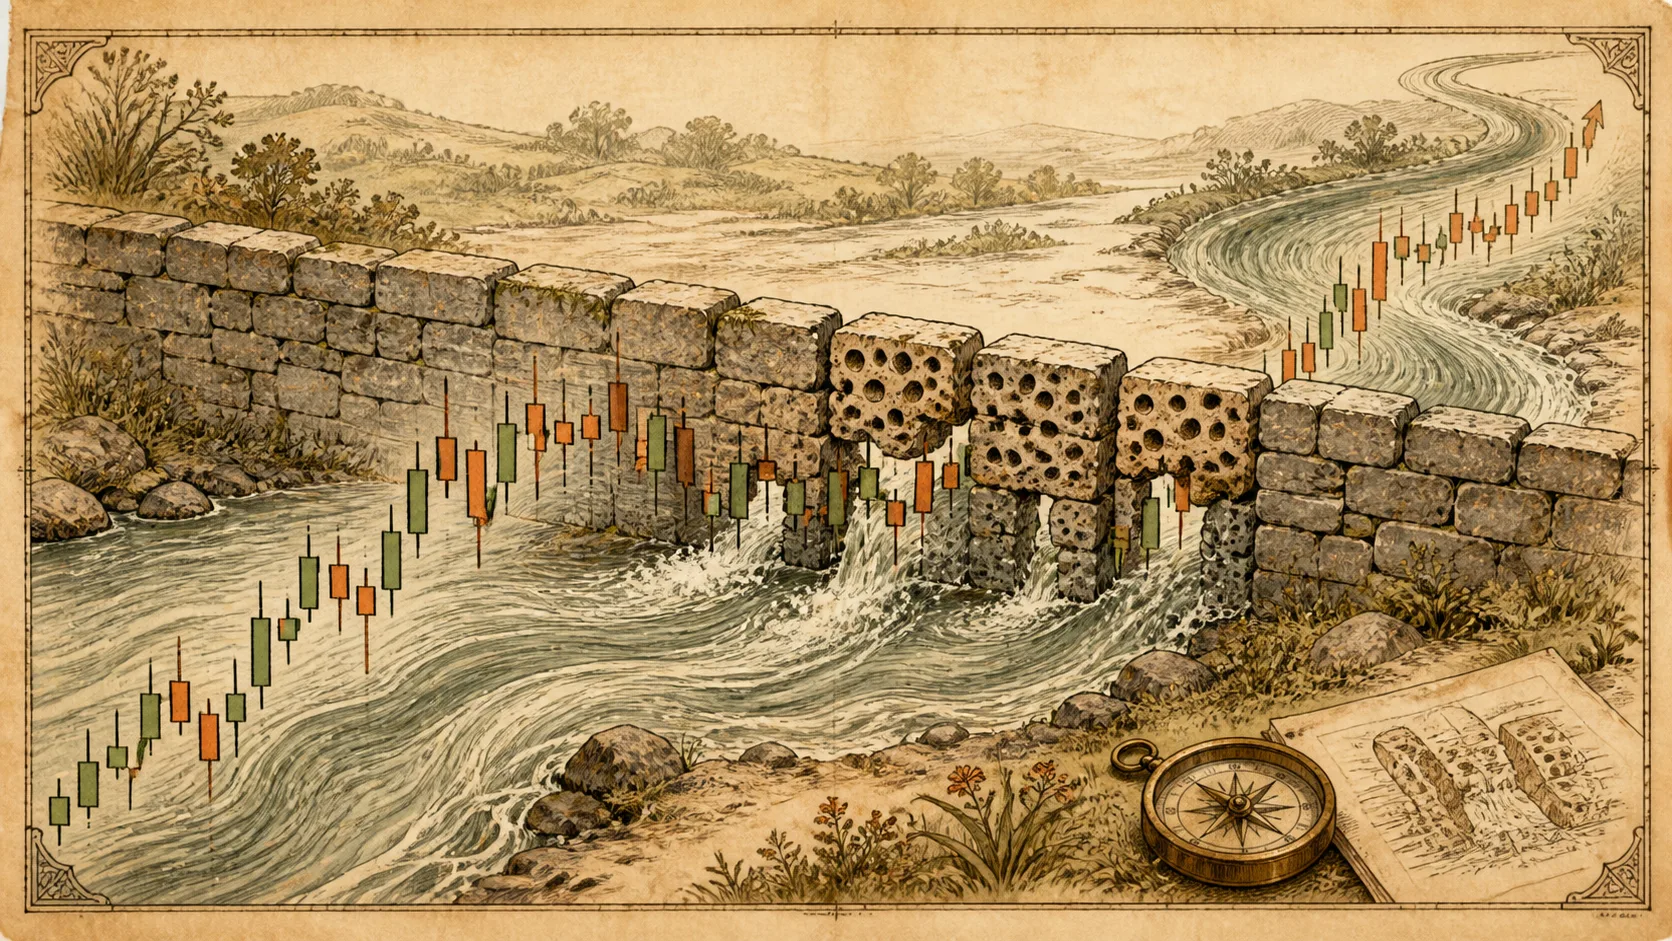
A support level is not a wall, and a resistance level is not a ceiling. Price can break through any of them, and understanding why they fail is as important as drawing them correctly.
Levels fail for structural reasons and for the way we use them: drawing hairlines, judging by wicks instead of closes, and assuming the first touch is the answer.
Support and resistance are probabilities, not guarantees. Levels fail because orders are dispersed, wicks overshoot, market conditions change, and traders misuse the concept by drawing hairlines and judging by wicks instead of closes. The correct mental model is: a wick is a test, a close beyond the zone is confirmation, and any single level can always break.
Orders Are Dispersed, Not Concentrated on a Point
Institutions accumulate at slightly different prices, so the buying or selling is spread across a band. If you drew a hairline at $100, the real demand may be centered at $100.30, or partially absorbed at $99.80. Price can push through your line without exhausting the actual force behind the level.
A level that is really a wide zone absorbs more, but it can still fail: if the orders behind it are consumed, the remaining supply or demand is simply gone.
Wicks Test, Closes Decide
A wick that pierces a level is a test of liquidity, not a breakdown. What matters is where candles close. If they close back inside the zone, the defense held. If they close beyond it on consecutive candles, the level has probably failed.
Traders who react to wicks get stopped out at the low of a test, then watch the market rally. The discipline of waiting for the close is what separates a real breakdown from a sweep.
| Trading day | Low | Close | Does the close hold the zone ($9.95–$10.05)? | Reading |
|---|---|---|---|---|
| Day 1 | $10.10 | $10.15 | Yes (above the zone) | Price is trading above the zone |
| Day 2 | $9.90 | $10.05 | Yes (close of $10.05 is inside the zone) | Wick pierced, close pulled back — a test, not a failure |
| Day 3 | $9.92 | $10.00 | Yes (close of $10.00 is inside the zone) | Tested again, close still holds |
| Day 4 | $9.85 | $9.90 | No (close of $9.90 is below $9.95) | First close beyond the zone |
| Day 5 | $9.80 | $9.85 | No (close of $9.85 is below $9.95) | Second consecutive close below — confirmed failure |
| Day 6 | $9.75 | $9.78 | No (close of $9.78 is below $9.95) | Price continues lower after confirmation |
Example rule: a single wick piercing the zone is not a failure; two consecutive closes below the zone's lower edge is what confirms it. Numbers are illustrative and do not represent any real stock's price action.
On Day 2 and Day 3, the low pierced the zone's $9.95 edge both times, but the close pulled back to $10.05 and $10.00 — under the close rule, these are just tests and the support is still standing. Only on Day 4 and Day 5, with two consecutive closes below $9.95, does the level count as confirmed broken; by Day 6 price is still falling, closing at $9.78, already $0.17 (about 1.7%) below the zone's edge. The same $9.95 level got pierced by a wick three times — the first two led nowhere, the last one started a real move. The only difference was whether the close followed through.
| Reason | What happens | How to respond |
|---|---|---|
| Dispersed orders | Real demand sits in a band, not on your line | Use zones, not hairlines |
| Wick sweeps | Price pokes through and snaps back | Wait for closes before acting |
| Changing conditions | New information shifts the balance | Re-evaluate the level's context |
| First-touch bias | The first touch is rarely the cleanest signal | Wait for reaction evidence inside the zone |
Market Conditions Change the Meaning of a Level
A support level built over months can break quickly if the fundamental or macro picture changes. The orders that supported it were placed under one set of conditions; when those conditions shift, the demand can disappear even though the price level looks the same.
This is why levels must be re-evaluated, not memorized. A level is a statement about where buyers and sellers reacted in the past. It says nothing about whether the same reaction will happen again.
The point of drawing support and resistance is not to know the future. It is to define where your idea is wrong, so you can size the trade and set a stop before anything happens.
Using the Possibility of Failure in Your Favor
If any level can break, the only sane use of support and resistance is risk definition. A zone gives you a place to put the stop and a reference for the target, not a guarantee of direction.
Treat a failed level as information: it tells you the market's balance has changed, and your plan should react to that rather than hoping the level comes back.
Frequently Asked Questions
How often do support and resistance levels fail?
There is no fixed rate. The honest answer is that they are probabilities, and a level that has not been tested is less reliable than one with a strong reaction history.
Is a broken support always a sell signal?
No. A close beyond the zone is one piece of evidence. It still needs context: volume, market structure, and whether a retest confirms or fails.
How do I know a level is reliable?
Reliability comes from repeated reactions, meaningful volume, and relevance to the broader structure. No single level is ever guaranteed.