
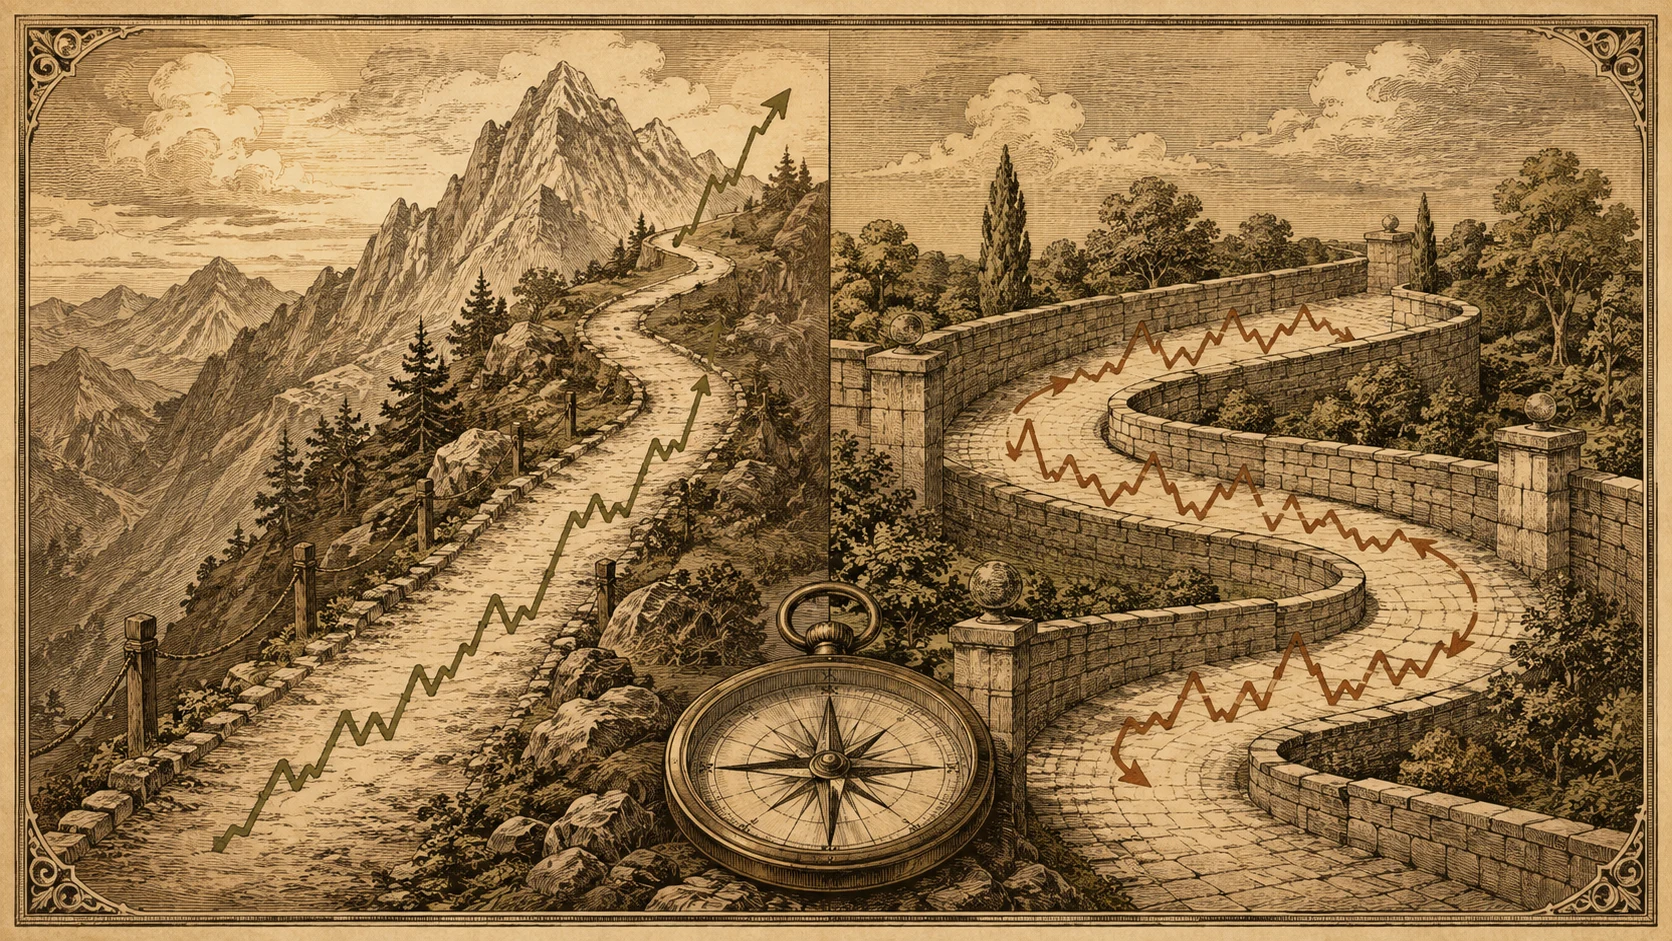
Ask any veteran trader about the secret to survival, and they will give you a variation of the same rule: trade with the market regime, not against it.
Yet beginner charts are routinely littered with indicators trying to apply trend-following tactics to sideways consolidations, or attempting mean-reversion trades against ferocious one-way momentum.
Before risking capital, you must answer one foundational question: is price currently climbing stairs in a directional trend, or pacing between the walls of a hallway in a range?
A trending market exhibits persistent directional displacement characterized by a sequence of Higher Highs and Higher Lows (uptrend) or Lower Highs and Lower Lows (downtrend). A range-bound market oscillates horizontally between established support and resistance boundaries with zero net directional progress. Diagnosing the regime requires observing structural swing pivots rather than relying blindly on lagging indicators.
| Dimension | Trending Market (Stairway) | Range-Bound Market (Hallway) |
|---|---|---|
| Price Structure | Clean sequence of HH/HL (uptrend) or LH/LL (downtrend) | Horizontal swing highs and lows aligning at common boundaries |
| Net Displacement | Strong directional distance covered over time | Price continuously returns to a central mean/equilibrium |
| Moving Average Behavior | Clean slope (angled 45 degrees), acts as dynamic trailing support | Flat, wavy, repeatedly whipsawed as price crosses back and forth |
| Breakout Quality | Breakouts of previous swing pivots show strong follow-through | Breakouts frequently stall, reverse, and fall back inside the range |
| Optimal Playbook | Pullback entries, breakout trend-following, trailing stops | Fade the extremes (buy support, sell resistance), quick profit targets |
The Stairway vs. The Hallway Analogy
Visualizing market states becomes simple when you picture physical architecture:
The Stairway (Trend): Each step you take is higher than the previous step. Even when your foot lowers momentarily during a step, it never falls below the preceding landing. That is an uptrend: pullbacks are shallow, and new highs are constantly minted.
The Hallway (Range): You walk forward 10 feet, hit a wall, turn around, walk back 10 feet, and hit the opposite wall. You might be sweating from all the pacing, but your net displacement across the building is exactly zero.
Beginners often rely on moving average crossovers (like the 20 EMA crossing the 50 SMA) to declare a trend. But moving averages are calculated from past prices. By the time a moving average tilts upward, a trend may already be nearing exhaustion. In a sideways range, moving averages flatten out, producing endless false crossover signals.
Beware the Noisy Middle
In a range-bound market, entering near the 50% midpoint between support and resistance often presents an unfavorable risk/reward profile.
In the middle, price can chop unpredictably in either direction with no clear invalidation point: your potential profit to the ceiling roughly equals your potential loss to the floor. Prudent range traders generally focus execution near the outer boundaries where risk is well-defined.
Frequently Asked Questions
How many swing touches confirm an active range?
A range requires at least two distinct rejections from the upper boundary (resistance) and two distinct rejections from the lower boundary (support) before you can reliably establish horizontal levels.
Can a market trend on one timeframe while ranging on another?
Yes, this happens constantly. A daily chart might be locked inside a multi-month sideways range, while a 5-minute chart within that same day exhibits a furious intraday uptrend from support toward resistance.
What is the best indicator for detecting market regime?
While pure price structure (swing highs/lows) is the most reliable, tools like Average True Range (ATR) to measure volatility expansion and the Average Directional Index (ADX) can help quantify trend strength.