
Institutions stagger orders
Different desks accumulate at $100.20 and $99.60, creating an absorption band rather than a single price point.
The most common rookie charting mistake is drawing hairline support and resistance levels accurate to two decimal places. When the market pierces the line by three cents, traders panic-sell at the exact bottom, only to watch price rocket back upward. Support and resistance are never thin paper walls — they are wide defensive battlegrounds.
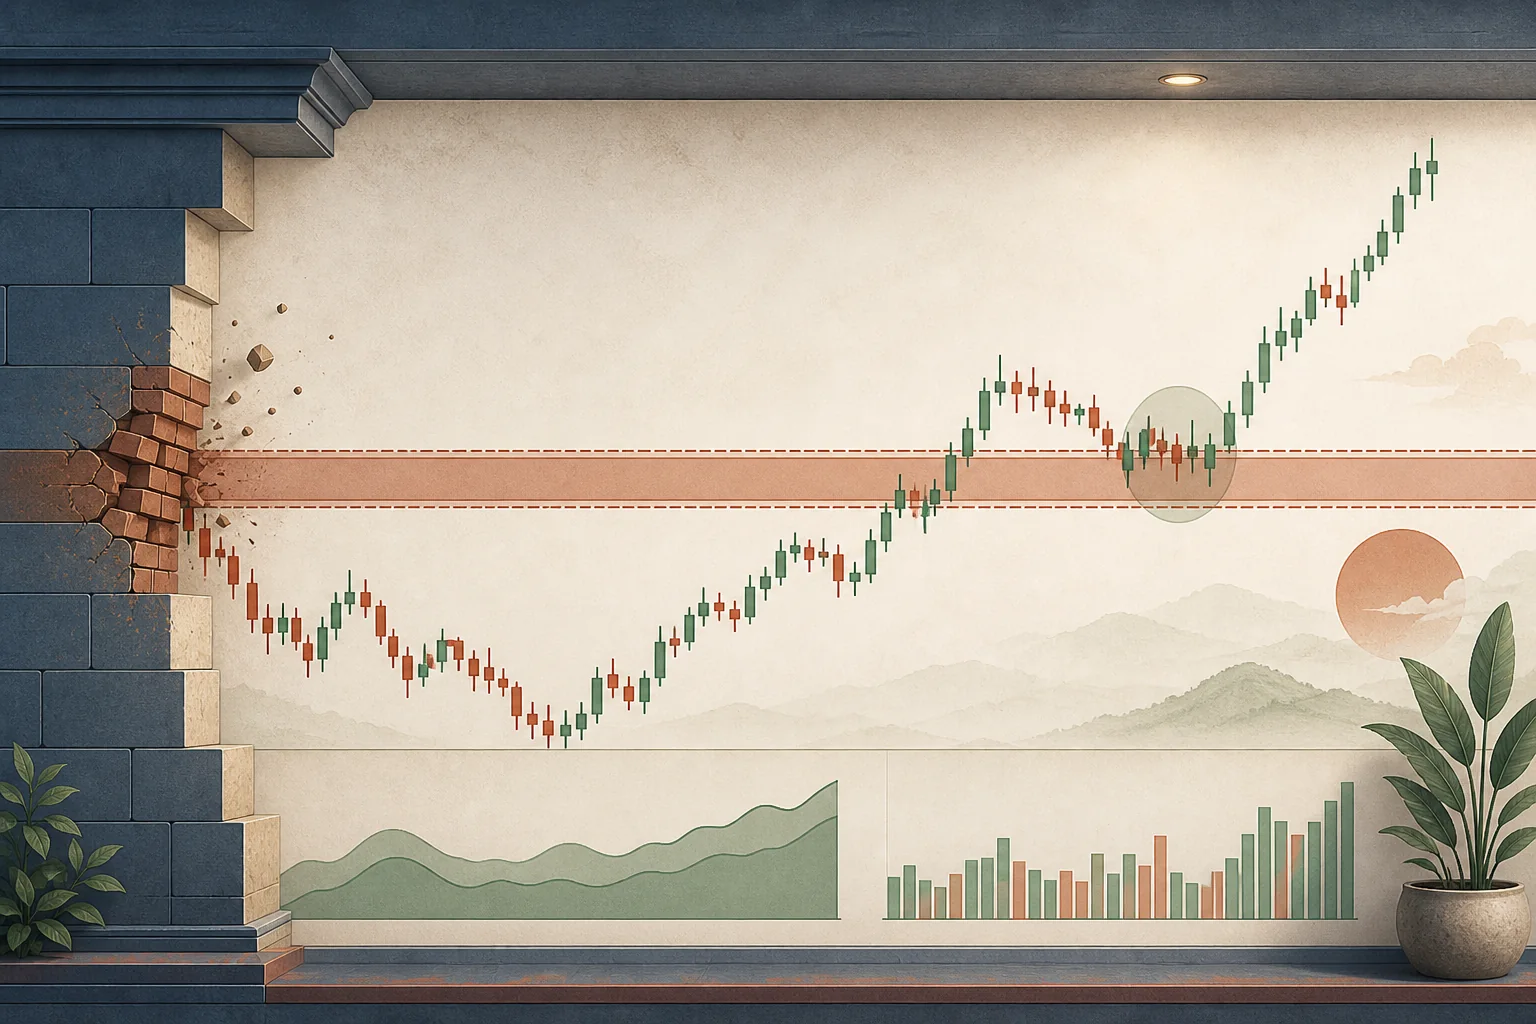
Think of support as a soccer backline or military trench: it's never a geometric chalk line, but a defense band with depth. Attackers might push a few yards in (a wick piercing the level), but as long as the ball is cleared out (candle close), the defense holds.
The exact same lower-wick candle · Two different trading approaches compared
Zone Advantage:Treats price as a reaction zone with depth. The lower wick sweeps below but closes safely inside the band, showing buyer interest and filtering noise.
Traders who fixate on single decimal lines panic whenever a wick breaches the level, getting stopped out at the absolute low before the true rally starts. Zone thinking absorbs normal intraday volatility and verifies defense on the candle close.
Real financial markets are driven by institutional order depth, not hairline prices. Drawing wide zones reflects actual microstructure reality:
Different desks accumulate at $100.20 and $99.60, creating an absorption band rather than a single price point.
If you draw a strict line at $100.00, a sweep to $99.70 triggers your panic exit right before the true rally begins.
Zones direct your attention to price behavior inside the band (deceleration vs expansion) rather than haggling over pennies.
Inspect 3 typical candlestick micro-patterns inside a historical reaction band
Interpretation:Price tests the zone multiple times, consistently producing lower wicks and higher reaction lows (HL), providing structural evidence of responsive buying interest.
Watch candle behavior inside the band: large bodies shrinking into long-wick hammers reveal passive bids absorbing aggressive selling, while rising reaction lows (HL) confirm structural reinforcement.
When price reaches a key zone, four distinct behavioral states can unfold. Avoid jumping to early conclusions until candles confirm the outcome:
Toggle between 4 classic candlestick interaction states at key zones
State 1 · Touch:Price has entered the observation zone. Buyer defense has not been confirmed yet. Maintain patience and await reaction evidence before considering entries.
The cardinal rule: 'The close determines the verdict.' Intraday wicks test liquidity, but only consecutive closes beyond the zone (Stay) confirm a genuine structural breakdown.
When a multi-month resistance zone at $100 is decisively shattered on huge volume, market psychology undergoes a permanent reset:
Encompass multi-touch turning points in a wide price band to absorb wick noise.
Key zones offer tight invalidation and favorable reward-to-risk ratios, but stops remain mandatory.
Never fire orders on the first touch; wait for rejection or stabilizing candle evidence.
3 practical questions to test your understanding of price reaction zones and S/R flips.
Share recent swing highs and lows with Mira to help identify optimal reaction zones.
Checking sign-in status...
Explain support/resistance as historical zones where buying or selling reactions occurred, and explain why a zone can fail and why a breakout doesn't guarantee continuation.