
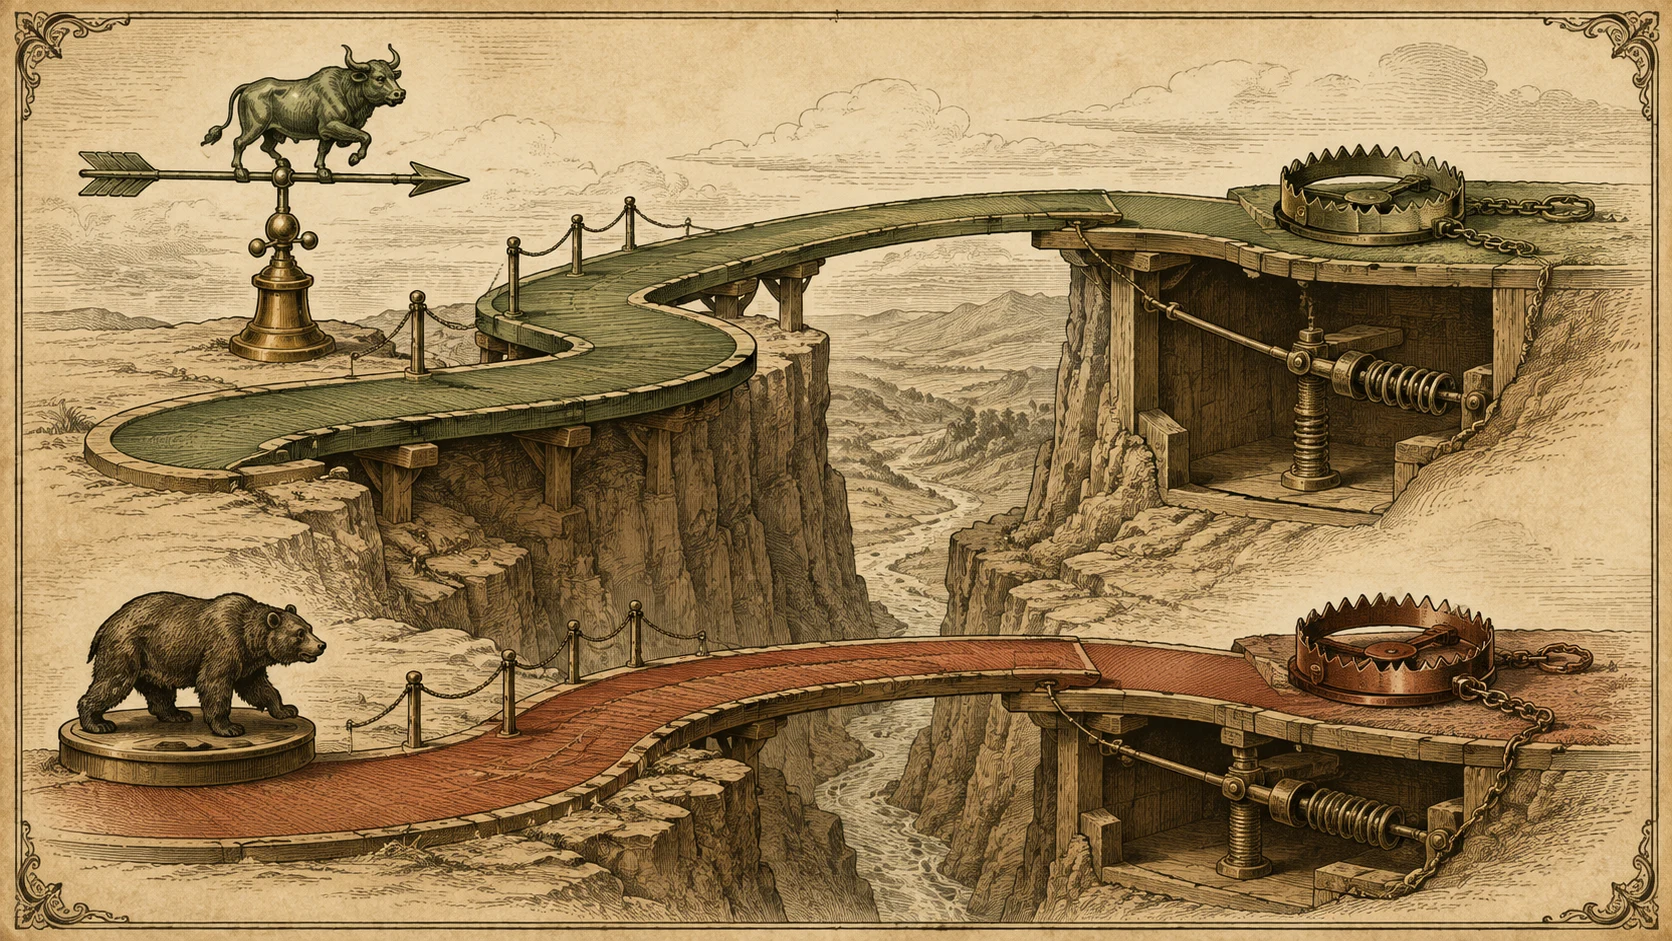
In financial market lore, few phrases strike as much dread into active traders as 'bull trap' and 'bear trap.'
Traders often describe them as deliberate, malicious acts orchestrated by mysterious 'market makers' or institutional whales out to steal retail capital.
Strip away the conspiracy theories, and you find a completely rational, mechanical process rooted in market microstructure: large participants fulfilling big orders using concentrated pools of counterpart liquidity.
Bull traps and bear traps are mirror structural formations created by liquidity absorption at extremes of consolidations or trends. A bull trap lures buyers into buying above resistance before reversing violently lower, fueled by the forced liquidation of trapped longs. A bear trap lures sellers into breaking down below support before surging aggressively higher, powered by short covering. These patterns occur when price crosses a widely watched level, follow-through fails, liquidity/orders around the level are triggered, and price re-enters the prior range.
| Feature | Bull Trap | Bear Trap |
|---|---|---|
| Location on Chart | Above established resistance, swing high, or consolidation roof | Below established support, swing low, or consolidation floor |
| Trapped Participants | Breakout buyers and late momentum longs | Breakdown short sellers and panicked liquidators |
| Trigger Mechanism | Resting buy-stops and aggressive market buy orders | Resting sell-stops and panic market dump orders |
| Subsequent Direction | Violent downward rotation back into or through the range | Aggressive upward surge/short squeeze back into the range |
| Key Reversal Candlestick | Shooting star, bearish engulfing, or gravestone doji | Hammer, bullish engulfing, or dragonfly doji |
The Four Phases of a Market Trap
Regardless of whether you are analyzing a bull trap at a multi-week high or a bear trap at a critical support breakdown, all market traps unfold across four distinct phases:
Phase 1: The Lure. Price approaches a visible chart boundary. Retail excitement builds, and stop orders cluster just beyond the line.
Phase 2: The Trigger. Price punches through the level. Stop-loss orders from counter-trend traders and market orders from breakout traders trigger simultaneously, producing an immediate burst of volume.
Phase 3: The Exhaustion. Once initial breach orders are executed, secondary market participation fails to sustain the move, causing price momentum to rapidly exhaust.
Phase 4: The Snap-Back. As price stalls and reverses, trapped breakout traders panic. In a bull trap, longs sell to cut losses, intensifying the down-move. In a bear trap, shorts buy to cover, propelling an explosive upward squeeze.
Key breakout levels naturally attract dense clusters of breakout entry orders and protective stop-loss orders. When price breaches a boundary, these orders trigger into market activity. If incoming market participants fail to absorb opposing liquidity and follow through, the imbalance dries up. As price re-enters the prior range, trapped traders liquidating positions combined with fresh responsive orders drive a swift reversal.
Frequently Asked Questions
How can I trade a confirmed bull trap safely?
When a bull trap confirms (price breaks resistance, prints a rejection candle, and closes back inside the range), traders observe the range reclaim and define invalidation based on the trap extreme (as an illustrative risk reference), managing exposure as price moves back inside the range.
Can volume confirm whether a trap is taking place?
Yes. Traps frequently exhibit abnormally high volume on the initial breach candle, but subsequent candles fail to make new highs or lows, revealing aggressive absorption by opposing limit orders.
What timeframe produces the most reliable bull and bear traps?
Higher timeframes (daily and 4-hour charts) produce the most reliable traps because liquidity pools at those levels represent weeks of accumulated resting orders.