
Transmission Map
How macro events travel through rates, flows and positioning into asset prices.
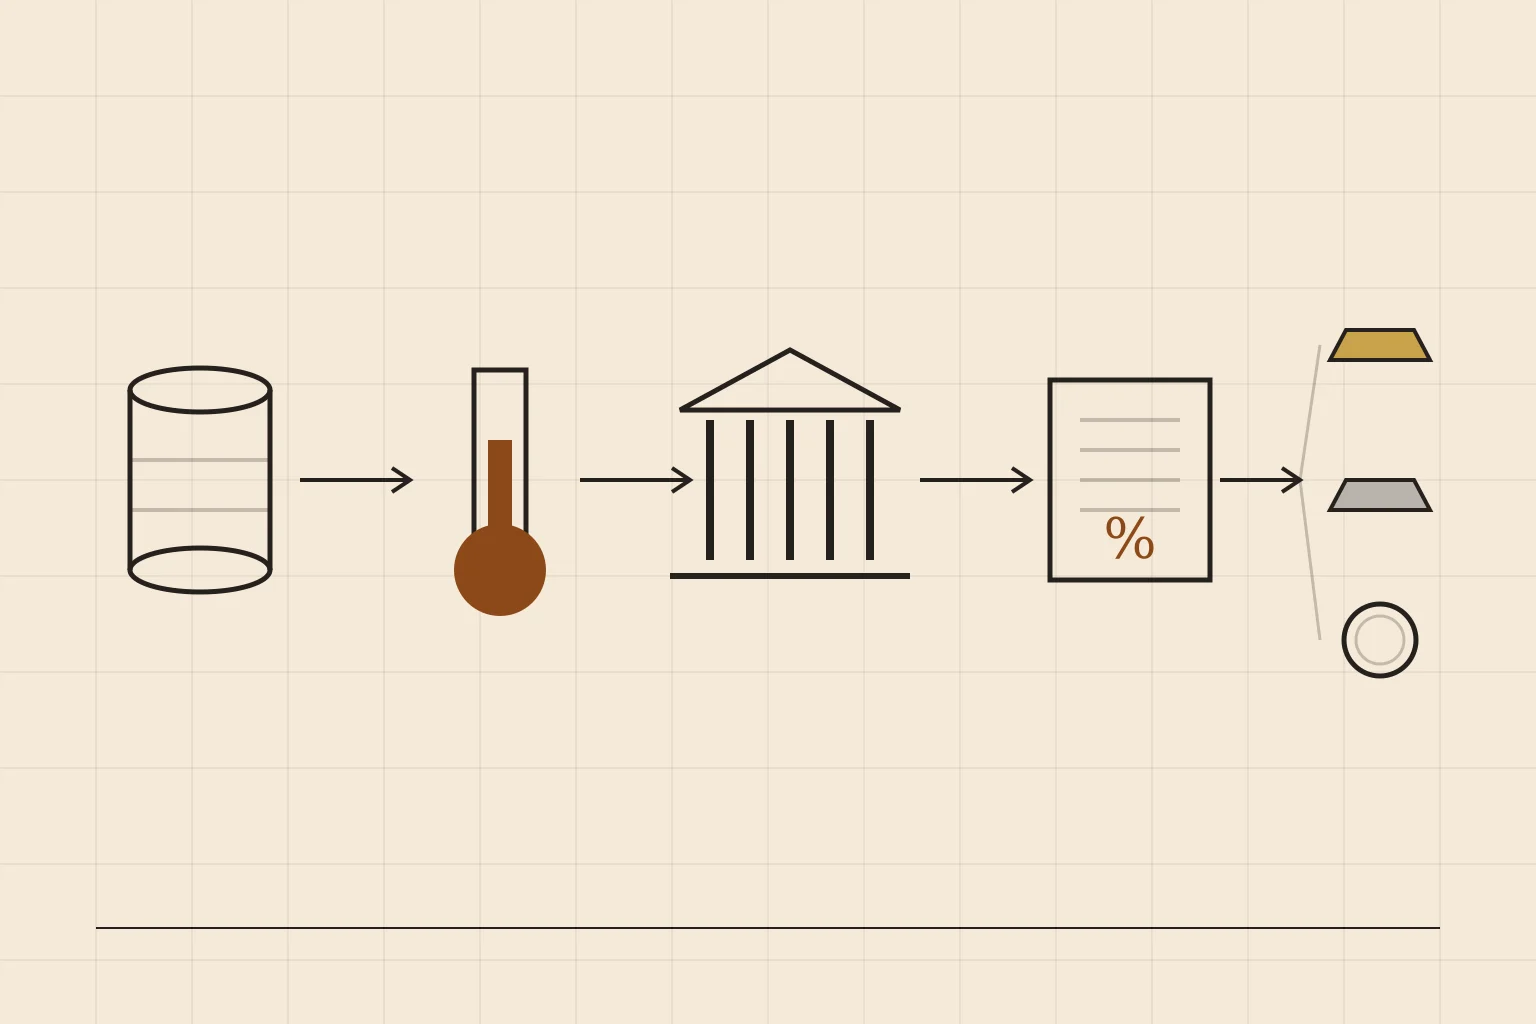
Macro Transmission Map Vol. 02: One chain from $100 oil to gold, silver and bitcoin
Oil lifts inflation, inflation keeps the Fed hiking, and the 10-year yield sits near its highest since 2002. Every asset that pays no income is paying for it. Where the chain is tight, where it could snap, and what Vol. 01 got wrong.

Gold Macro Transmission Map Vol. 01: Saudi Pipeline Repairs Knocked Oil Down, Fueling a Squeeze to $4,394
Fed hike impact was partially absorbed by markets, while falling oil and declining Treasury yields triggered a sharp rebound in gold. Four-layer dynamic matrix, three-scenario roadmaps, and forecast audit ledger.