

Now
Across 24 Hours, Core Variables Driving Bullion Shifted in Unison
$4,394.20
Spot Gold (XAU/USD)
+1.85% (+$50 intraday)
$102.50
Brent Crude
-7.0% (3-day drop)
4.93%
10-Year US Treasury Yield
-8 bps (breaks 5%)
100.25
US Dollar Index (DXY)
Retreats from 101
What Is the Market Really Trading Right Now?
Over the past 72 hours, the decisive macro shift occurred outside of gold: crude oil plummeted, and benchmark 10-year Treasury yields broke lower in tandem. Brent dropped from $108.75 to $102.50, 10Y yields pulled back from 5.01% to 4.93%, and DXY retreated to 100.25. In lockstep, spot gold staged a sharp rebound from recent lows, reclaiming $4,394.
This move is a rate-relief valuation rebound and a technical short squeeze, not the opening leg of a structural bull market. The hike shock was partly absorbed, falling oil opened room for revaluation, and shorts covering above key resistance steepened the ascent further.
Visualizing today's market, three distinct capital pools share the room:
• Anchor Money (Central Banks): Official reserve diversification continues uninterrupted, providing multi-year structural support.
• Momentum Money (ETFs & Trend Followers): August net inflows reached +121 tonnes. Strong momentum fuels aggressive short-covering buy programs.
• Calculating Big Money (Macro Bond Capital): With 10Y yields retreating from 5%, opportunity cost pressures have eased, prompting a fresh look at bullion.
Gold has shifted from 'three conflicting capital forces' to 'two supportive forces and one hesitating.' However, the Fed's September 16 hike to 3.75%–4.00% remains in force, and October hike odds still stand at 57.4% (CME FedWatch). The overhead rate ceiling has not been dismantled; it simply stopped worsening.
What Changed
What Truly Shifted Over the Past Week?
Do not begin with price changes. Track the fundamental macro variables driving capital reallocation.
| Core Variable | Prior State → Current State (9/18) | Underlying Shift & Impact on Gold |
|---|---|---|
| Brent Crude | 9/15 ~$108.75 → $102.50 | Aramco plans ~50% throughput recovery + 60M bbl Oman STS cushion, defusing worst-case supply panic and energy inflation alerts |
| 10-Year US Treasury Yield | 9/16 ~5.01% → 4.93% | Broke below psychological 5% barrier; opportunity cost of holding non-yielding bullion dropped markedly |
| Fed Policy Rate | 3.50%–3.75% → 3.75%–4.00% | 9/16 25bp hike delivered, largely digested by markets as expected defensive tightening (Sell the rumor, buy the fact) |
| October Hike Odds | Pre-meeting split → ~57.4% probability (CME FedWatch) | Futures pricing remains hawkish, capping runaway euphoria and defining this advance as valuation relief |
| Global Physical Gold ETFs | July net positive → August +121 tonnes | Total holdings reached record 4,189 tonnes; non-bank institutional capital is genuinely returning |
| Central Bank Demand | Q1 rev. 57t → Q2 289t (July +23t) | WGC officially revised Q1 preliminary 244t down to 57t; official accumulation rebounded sharply in Q2, providing structural support |
Transmission
Which Layer Did This Event Truly Penetrate?
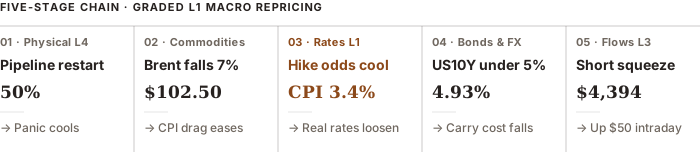
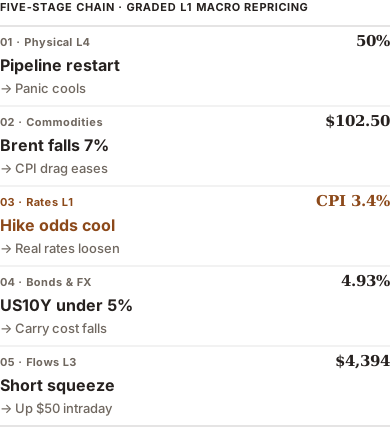
Earlier this week, an attack on Saudi Arabia's East-West Pipeline severed crude flows to Yanbu, pushing crude toward $110. The turning point arrived when Saudi Aramco initiated emergency ship-to-ship (STS) transfers off Oman for 60M barrels and announced plans to restore ~50% pipeline throughput within days, sending Brent tumbling 7% to $102.50.
This news penetrated through a strict 5-stage causal chain into gold's pricing engine, formally classified as Grade L1 macro repricing:
Paths
Three Price Paths: Target Ranges and Key Triggers
We do not forecast single price points. We outline three conditional maps with explicit order-book rationales. A scenario activates only when its conditions are met.
Core branching switch: Crude oil trajectory × Whether the 10Y yield re-establishes above 5.00%
Range Consolidation
$4,250 – $4,600
Brent stabilizes at $95–$105 · US10Y oscillates in 4.90%–4.98%
Rate-relief valuation rebound; consolidation capped by rate ceiling
US10Y closes sustainably > 5.00% or global ETFs turn to net outflows
Macro Repricing
$4,600 – $4,900
Brent drops below $95 · US10Y drops to 4.80% · Softening USD
Energy disinflation defuses headwinds; clearing resistance opens path to $5,000
Oil falls but US10Y counter-trends back above 5.00%
Energy Tail Risk
$4,000 – $4,250
Brent surges above $110 · US10Y breaks above 5.05%
Secondary inflation shock lifts rate terminal; breakdown tests H1 lows
If oil & yields surge but gold holds > $4,350 (safe haven bid overrides rates)
Macro Deductions & Transmission Chains
Range Consolidation: why it is the likeliest path
A force presses from each side, which is why this is a range and not a trend. Above sits the rate ceiling — futures still price a 57.4% chance of another 25bp hike in October, so the tightening cycle is not finished. Below sits physical demand — August ETF inflows of 121 tonnes pushed total holdings to a record 4,189 tonnes, and central bank buying recovered to 289 tonnes in Q2. While neither side withdraws, gold can only travel between $4,250 and $4,600.
Macro Repricing: the link that cannot break
The upside needs a full chain to hold: Brent below $95, imported inflation pressure fading, the Fed revising its hike path lower, the 10-year yield sliding toward 4.80% — only then does the cost of holding gold actually fall. Break any link and the rest does not follow. The link to watch is oil falling while yields do not, which would say inflation is stuck in services rather than energy, and no oil price gets gold out from under the rate ceiling.
Energy Tail Risk: falsify it before shorting
The downside chain runs from stalled repairs, to Brent back above $110, to a second inflation scare, to the 10-year breaking 5.05%, to leveraged longs stopped out. But the path carries its own falsification: if oil and yields both climb and gold still holds above $4,350, safe-haven bids have overpowered the discounting logic, and shorting mechanically on rates will lose money.
What's Next
Macro Verification Schedule Over the Next Month
Forecast Ledger
Historical Audit Trail & Conditional Roadmap Record
| Audit Dimension | Vol. 01 Filed Record (2026-09-18) |
|---|---|
| Benchmark Spot Gold | $4,394.20 / oz (9/18 17:00 BJT / 09:00 UTC) |
| Regime Classification | Rate-Relief Rebound (Transmission Grade L1) |
| Base Scenario | $4,250–$4,600 Consolidation Range |
| Bull Scenario | $4,600–$4,900 (Requires Oil < $95 and 10Y < 4.88%) |
| Bear Scenario | $4,000–$4,250 (Requires Oil > $110 and 10Y > 5.05%) |
| Primary Upside Confirmation | US10Y sustainably lower + Weaker USD + Continued ETF inflows |
| Primary Invalidation Condition | US10Y sustainably above 5.00% + Sustained ETF liquidation |
| Follow-Up Mandate | Next edition will not tell a new story; it will answer one question: What changed? |
Takeaways
This rally is valuation relief and a short squeeze triggered by: 'Crude plunges → Energy inflation cools → US10Y breaks below 5% → Gold holding hurdles drop.' It completed an L1 macro repricing, but the sovereign reserve anchor remains untouched.
Forward verification relies strictly on three aligned signals: Brent ↓, US10Y ↓, and ETF ↑. Sustained confluence is required to transform relief into an intermediate bull trend; if oil and yields turn back up, this roadmap is immediately invalidated.
Sources
- Bloomberg / ReutersAramco Plans East-West Pipeline 50% Restart within Days and Activates Oman Sohar STS Shipments
- World Gold CouncilGold Demand Trends Q2 2026 (Central Bank Q1 demand revised to 57t, Q2 289t)
- World Gold CouncilGold ETF Holdings and Flows - August 2026 (Published Sep 9, 2026; Net Inflow +121t, Total AUM 4,189t)
- CME GroupCME FedWatch Tool (Snapshot: 2026-09-18 17:00 BJT / 09:00 UTC; Oct 2026 25bp hike probability at 57.4%)
- Bureau of Labor StatisticsBureau of Labor Statistics (BLS) · Consumer Price Index August 2026 (Released Sep 11, 2026 Snapshot)
Further reading
Learn the concepts behind this story
Key analytical frameworks behind this transmission map: