
Now
Four readings, one story
~$103.50
Brent crude
Hormuz crude flows at a two-month low
+27.4%
US gasoline prices, year on year
August CPI; headline inflation 3.4%
3.75–4.00%
Fed funds target
Most officials see another hike by year-end
5.22%
10-year Treasury yield
5.31% on Oct 5, highest since 2002
What the market is really trading
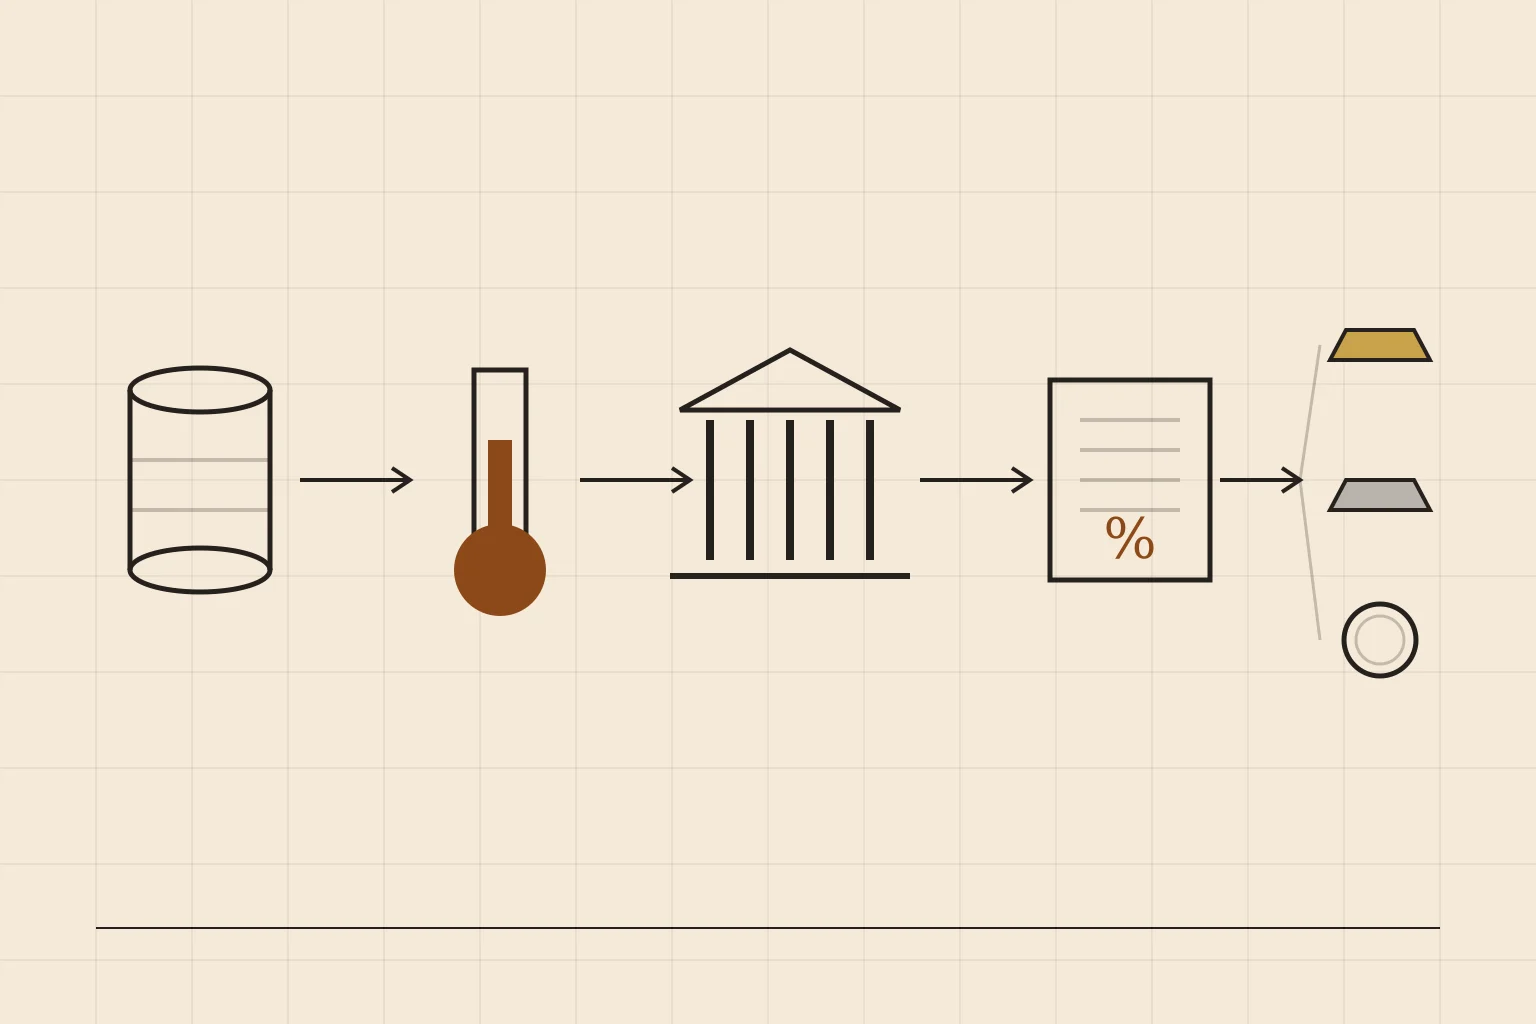
Gold, silver and bitcoin fell to two-month lows this week, each with its own headline: dollar strength for gold, industrial worries for silver, ETF outflows for bitcoin. Read together, the headlines are one story told four times. Oil above $100 is keeping inflation high, high inflation is keeping the Fed hiking, and a hiking Fed is keeping Treasury yields near their highest since 2002.
The September FOMC minutes say this out loud. Many officials warned that the longer energy prices stay high, the more likely they spread into other prices, and most expect another increase by year-end. The market has moved the next hike to December; the September CPI on October 14 is the last inflation reading before the October 27–28 meeting.
The hen next door
Think of gold, silver and bitcoin as hens that lay no eggs. Nobody buys them for income; they buy them for what they might be worth later, or for protection. What people will pay for a hen like that depends on what the hen next door lays. The hen next door is the US Treasury, and today it lays an egg worth about 5.2% a year.
Oil is the feed bill for the whole farm. When feed gets expensive, everything on the farm costs more, which is inflation. The farmer's answer is to make money dearer: the Fed raises rates. Dearer money makes the Treasury's egg bigger, and a bigger egg next door makes the egg-less hens look worse.
The same picture explains the differences between the three. Silver also works the farm, as an industrial metal, so a slowing economy hurts it twice. Bitcoin is often bought with borrowed money, so dearer money also raises what it costs to keep holding it. Gold has only the one problem, which is why it has fallen about half as far as silver this month. When the egg next door grows, every hen that lays nothing gets cheaper; the only question is how fast.
The chain
Link by link: how tight is it now?
A chain only transmits force while every link holds. This is where each link stands.
| Link | Evidence | How tight |
|---|---|---|
| Oil → inflation | Gasoline +27.4% y/y; headline CPI 3.4% in August, ~3.7% expected for September | Tight. The open question is whether energy spreads into core, which has stayed near 2.4%. The September CPI predates this month's oil jump, so it tests earlier pass-through only. |
| Inflation → Fed | Hike to 3.75–4.00% in September, 12–0; minutes cite energy and the Middle East | Tight. The Fed has named energy as a reason to keep going. |
| Fed → yields and dollar | 10-year 5.22–5.31% this week; dollar near its strongest since June | Tight, with heavy government borrowing adding to the pressure on long yields. |
| Yields → gold, silver, bitcoin | All three hit two-month lows this week; bitcoin ETFs saw their biggest daily outflow since June | Tight. A record week of tanker attacks has not produced a lasting safe-haven bid. |
Forecast ledger
Vol. 01 audit: what we got wrong
| Item | Record |
|---|---|
| Vol. 01 base case | Gold $4,250–$4,600, consolidating after a rate-relief rebound |
| Vol. 01 invalidation | 10-year sustainably above 5.00% |
| What happened | 10-year rose to 5.31%; gold fell to about $4,100 |
| Verdict | Base case invalidated. Gold reached the bear range ($4,000–$4,250) |
| What we missed | The bear case also required Brent above $110. Oil stayed near $104, and yields did the damage alone |
| Lesson carried forward | The rate link transmits pressure even when oil does not spike. Vol. 02 tracks yields as the primary trigger, oil as the amplifier |
You've reached the end of the free preview
Premium Research
Read the full research.
Go deeper into this analysis with MyTrade Pro. One membership includes every research edition and the full interactive learning experience.
Continue with these sections
- Three paths to the October 28 Fed meeting
- Same chain, different grip
- Three signals that the chain is breaking
A one-time allowance of 3 full articles with a free account.
Sources
- Federal ReserveFOMC statement, September 16, 2026
- Federal ReserveMinutes of the FOMC, September 15–16, 2026
- U.S. Bureau of Labor StatisticsConsumer Price Index, August 2026
- U.S. TreasuryDaily Treasury par yield curve rates, October 2026
- OPECMeeting of seven OPEC+ countries on November production