
You spend a Saturday afternoon scrolling through historical charts. Every setup looks obvious, every entry looks clean, and your spreadsheet shows an eye-popping 80% win rate. You feel like you have unlocked the code to the market.
Then Monday morning arrives. You fund an account, trade the exact same setup, and lose five trades in a row. What happened? Your strategy did not fail; your backtest lied to you. When scrolling charts by hand, the human brain unconsciously cheats at every step unless restrained by strict testing guardrails.
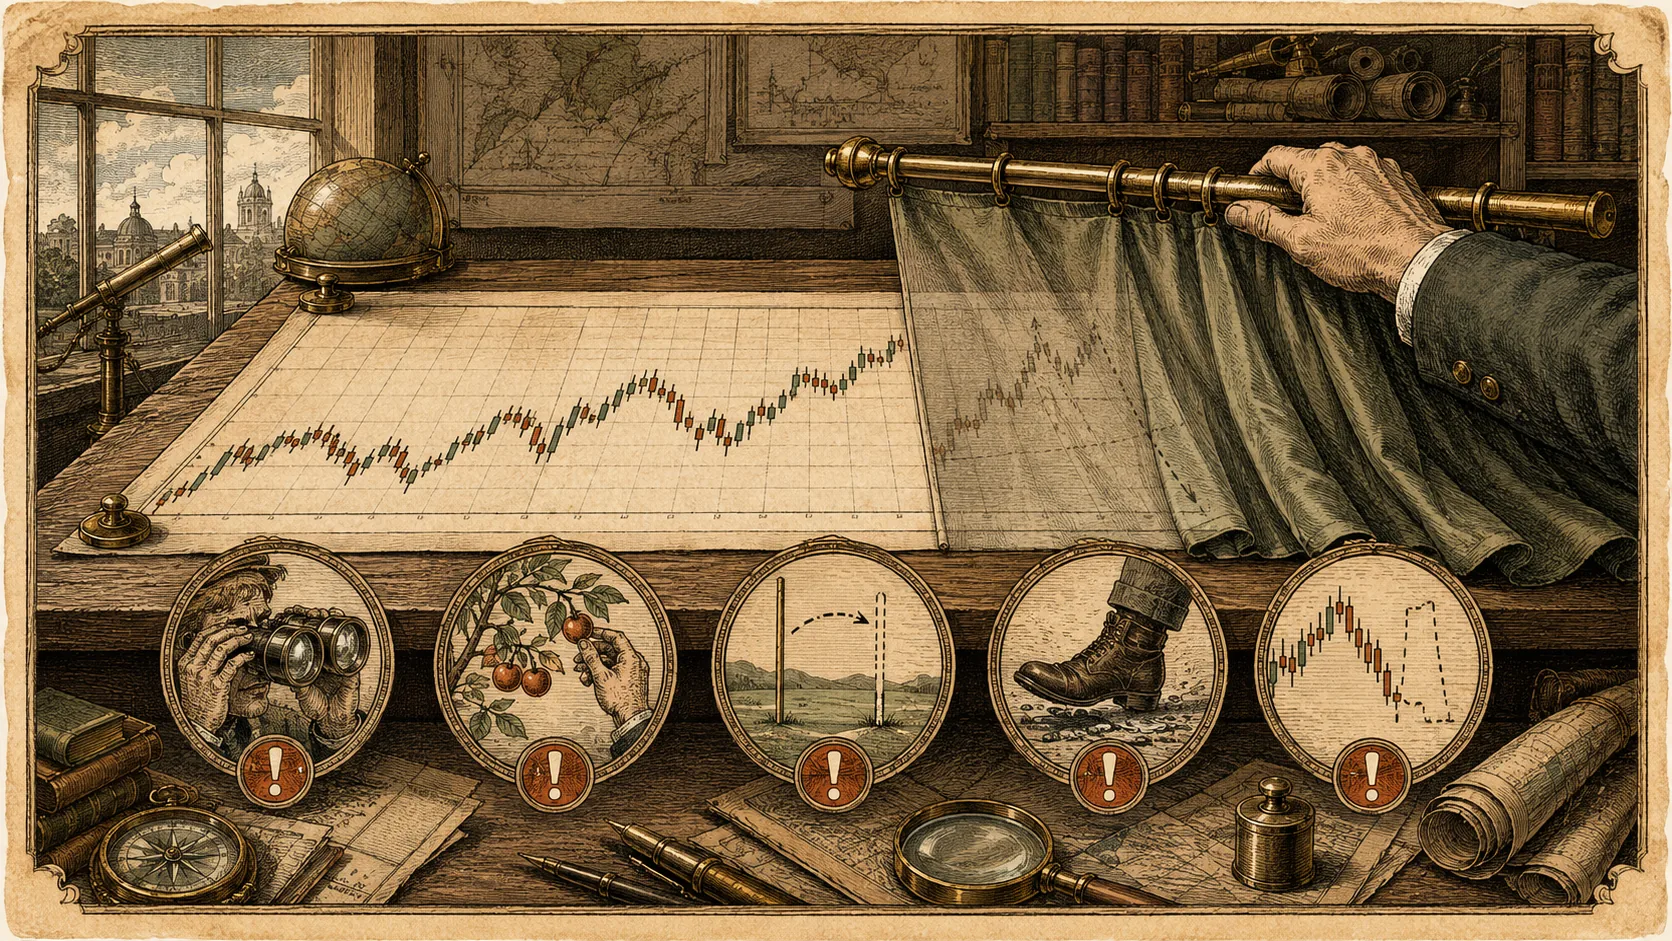
Manual backtesting produces dangerously deceptive results when five rookie traps occur: peeking ahead at future candles before logging the trade; cherry-picking textbook charts while scrolling past messy consolidations; tweaking the rules mid-test whenever a loss appears; omitting realistic commissions and spreads; and rationalizing that losing trades 'would not have been taken live.' To make a backtest honest, use bar-replay tools to hide the right edge of the chart, lock your rules before candle 1, and count every single valid trigger—especially the losers.
Mistake 1: The 'Sneak Peek' (Knowing What Happened Next)
The most common way traders fake a backtest is by testing with the entire chart visible.
Your eyes cannot help glancing at the right side of the screen. Subconsciously, you already know that two candles later the stock surged $10. Suddenly, a mediocre, messy entry setup looks 'compelling.' You record it as a win.
Conversely, when you spot a setup where price subsequently collapsed, your brain invents an excuse: 'Well, the volume looked a little suspicious here, so in live trading I wouldn't have taken this one.' You skip it. Without realizing it, you have filtered out the losers and cherry-picked the winners using future knowledge.
Mistake 2: Moving the Goalposts Mid-Test
You begin testing a 20-period moving average breakout. Trade 1 wins; Trade 2 wins; Trade 3 loses because a wick tapped your stop before price rocketed higher.
Frustrated, you think: 'If I just add a 2% buffer to my stop, Trade 3 would have survived and won!' You change your stop rule in row 4. At trade 12, a consolidation whipsaws you, so you add an RSI filter: 'Only buy if RSI is above 50.'
By trade 30, your rules have morphed five times. You are no longer testing a strategy; you are custom-tailoring a suit to fit one specific historical mannequin. In statistics, this is called curve-fitting. The moment you take this over-tuned franken-strategy into live markets, it collapses because future prices never repeat that exact sequence.
| The Sin | How Traders Cheat | The Antidote |
|---|---|---|
| 1. Peeking Ahead | Looking at the right side of the chart before marking entry | Use Bar Replay tools to completely conceal unformed candles |
| 2. Cherry-Picking Charts | Only testing famous bull-market years or smooth stocks | Test full chronological calendar blocks including hostile chop |
| 3. Mid-Test Tweaking | Modifying rules every time a loss occurs | Lock rules for 50 trades; log flaws for the next test version |
| 4. Zero-Friction Fantasy | Assuming fills at exact candle extremes with zero fees | Deduct automatic broker fees and realistic spread per trade |
| 5. 'This One Doesn't Count' | Excusing losses as 'bad luck' while counting all wins | If the trigger criteria were met, the trade must be recorded |
Your goal in a manual backtest is not to generate the highest possible win rate on paper; it is to discover how hard your strategy can be hit before it breaks.
Mistake 3: Testing Only 'Friendly' Market Phases
A breakout strategy looks like pure genius when backtested exclusively across a roaring bull market. If you only test tech stocks during a historic expansion, virtually every dipped moving average or resistance breakout eventually resolves higher.
A robust test must deliberately challenge the rules against hostile environments: brutal bear markets, tight low-volume summer ranges, and sudden volatility spikes. If a system cannot survive a three-month sideways grinder in backtesting, it will bankrupt you when you encounter that grinder in live trading.
Never test on a static chart where the outcome is visible. Use the 'Bar Replay' or candle-stepping feature available in modern charting software. Cut off the chart before the trade, place your crosshair on the entry bar, write down your entry and stop prices in your worksheet, and only then advance the chart candle by candle until the trade resolves.
- The right edge of the chart is covered; I advance one candle at a time.
- My rules are written in ink and cannot be changed until all 50 trades are logged.
- Every signal that meets the written criteria is logged, without exception.
- I deducted fees and spread slippage from every single result.
Frequently Asked Questions
What should I do when I discover an obvious improvement mid-test?
Do not change the current test. Create a note titled 'Version 2 Hypothesis: Add 2.0 ATR buffer to stop.' Complete the 50 trades under Version 1 rules. Then, run a brand-new 50-trade test for Version 2 and compare the final results.
Is an 80% win rate in a manual backtest realistic?
Very rarely for directional trend or breakout strategies, which typically rely on winning trades being larger than losing trades rather than an exceptionally high win rate. If your manual backtest produces an unusually high win rate like 80% or 85%, it strongly suggests you may be peeking at unformed candles or filtering out losing trades with hindsight.
Why is manual backtesting better than automated coding for beginners?
Manual testing forces you to look at hundreds of chart examples, teaching your eyes to recognize subtle market context, support/resistance quality, and volatility shifts that rigid code often misses. It builds genuine visual intuition.