
Most manual backtests end in frustration because the trader merely glances at charts, nods approvingly at winning patterns, and tallies up a vague mental score: 'Looks like this strategy wins about 70% of the time.'
Mental backtesting is an illusion. To know whether a rule set actually produces an edge, you need a disciplined, standardized backtest trade log. A well-constructed worksheet turns fuzzy chart memories into cold, audit-ready statistics.
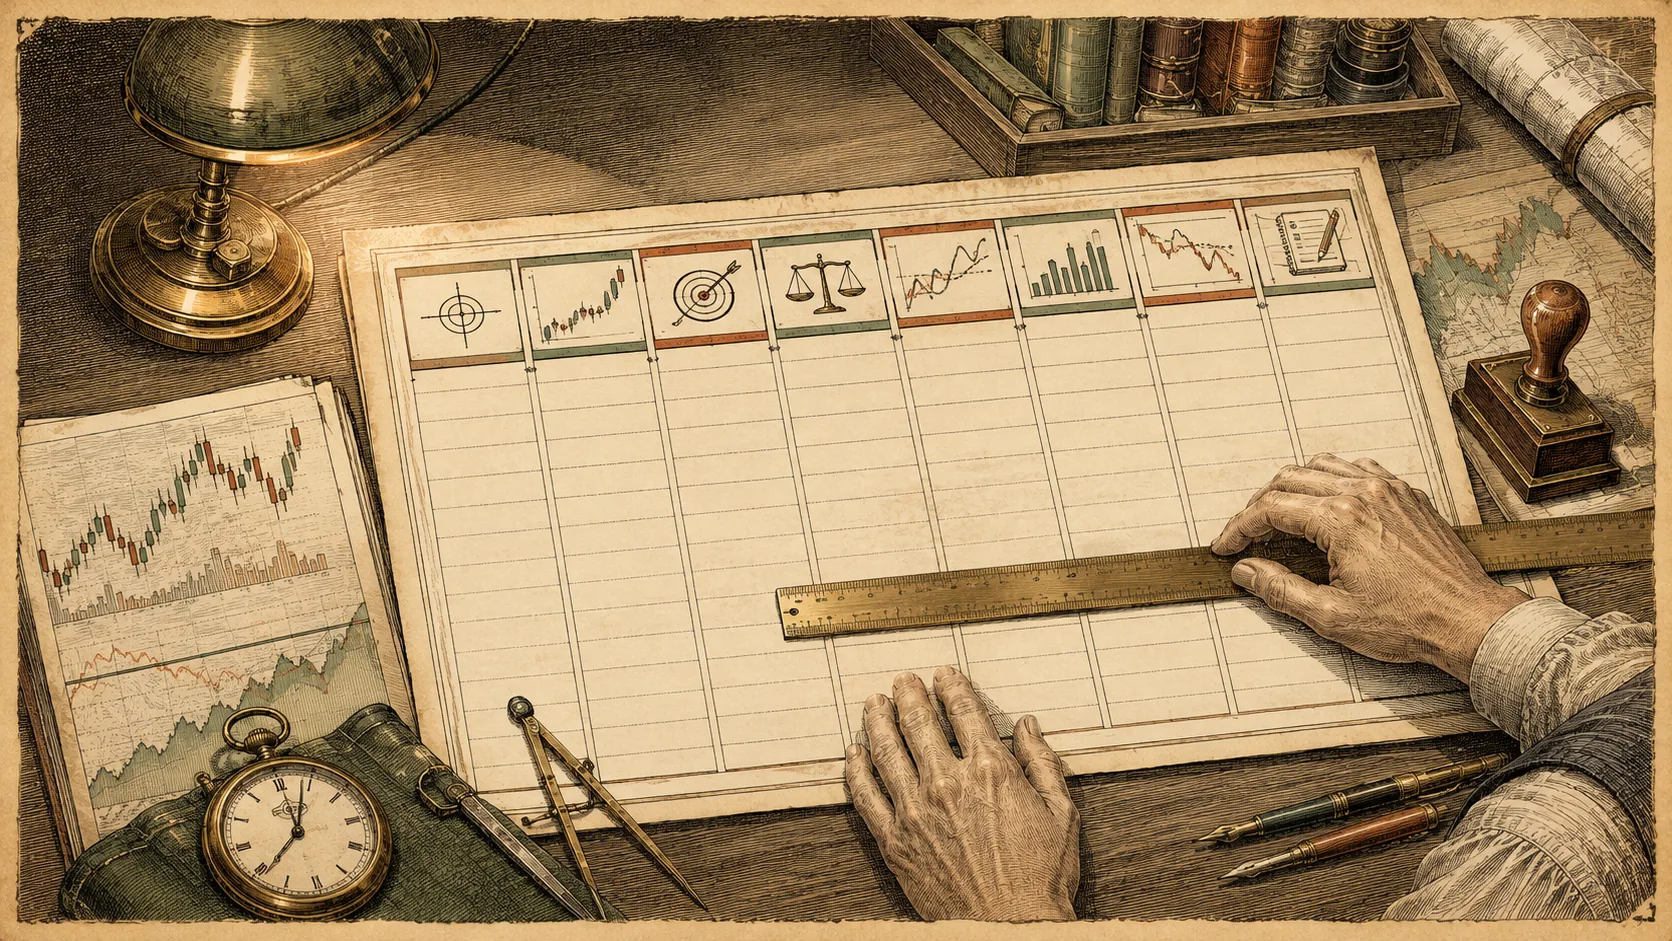
An honest backtest log requires eight non-negotiable columns: Date/Candle Timestamp, Setup Condition Met, Entry Price, Initial Stop-Loss (1R), Exit Price, Exit Reason, Friction Deductions (Fees & Slippage), and Net R-Result. Unlike a live trading journal that tracks psychology, a backtest log rigorously tracks rule repeatability. Never log a trade without recording the exact initial stop, and always deduct realistic execution friction to avoid paper fantasies.
How a Backtest Log Differs from a Live Trading Journal
While both tools use tabular rows, their jobs are completely different.
A live trading journal (like the one built in Lesson 30) focuses heavily on human execution: your emotions, your hesitation, and whether your psychology deviated from your plan in the heat of the moment.
A backtest trade log, by contrast, assumes mechanical adherence and tests the rule system itself across history. It strips out emotions and focuses entirely on structural validity: Did the trigger conditions exist? What was the exact price distance to the invalidation level? How many bars did the trade take to resolve? What was the net payoff after trading fees?
| Column Name | What to Record | Why It Is Mandatory |
|---|---|---|
| 1. Date & Timestamp | Date and bar time of the entry candle | Anchors the trade to a verifiable historical chart coordinate |
| 2. Setup Name | Specific setup tag (e.g., #BullFlag, #Breakout) | Allows subset filtering to see which specific variations work |
| 3. Entry Price | Exact fill price specified by rule (e.g., break of high) | Prevents assuming you bought at the absolute candle bottom |
| 4. Initial Stop Price | Pre-defined invalidation level (1R risk distance) | Defines the baseline risk unit needed to calculate R-multiples |
| 5. Exit Price | Price where the exit rule triggered | Calculates raw price gain or loss |
| 6. Exit Reason | Target Hit, Stop Hit, Time Exit, or Trail Trigger | Reveals how your system actually exits across market regimes |
| 7. Friction Estimate | Commissions + realistic bid-ask spread deduction | Transforms gross theoretical returns into net cash reality |
| 8. Net R-Multiple | (Net dollar profit / initial 1R dollar risk) | Normalizes every trade into standard risk-adjusted performance |
Never record Column 5 (Exit) without first locking in Column 4 (Initial Stop). If you change the stop after seeing the outcome, you are fabricating data.
The Zero-Friction Fantasy: Why Gross Backtests Lie
The single biggest reason profitable backtests fail in live markets is the omission of transaction friction.
Suppose you backtest a 15-minute momentum strategy across 100 trades. The raw results show 55 wins and 45 losses, generating an apparent profit of +18.5R. You feel triumphant.
Now subtract 0.15R per trade for exchange fees, broker commissions, and real-world bid-ask spread slippage. Over 100 trades, friction silently consumes 15.0R. Your sparkling +18.5R edge collapses to an anemic +3.5R—barely breaking even. An honest backtest worksheet must include an automatic friction deduction column on every single row.
For long trades: Raw Profit = (Exit Price − Entry Price) × Position Units. Net Profit = Raw Profit − Estimated Friction. Net R = Net Profit ÷ (Entry Price − Initial Stop Price) / Position Units. Using R-multiples allows you to test historical setups consistently without worrying about account compounding math.
- Every row records the initial stop-loss before evaluating the exit.
- A standard fee and spread deduction is applied to every trade.
- Ambiguous bars (where both stop and target were touched in the same candle) are marked as stops by default.
- The log records holding duration (number of bars) to evaluate capital efficiency.
Frequently Asked Questions
What spreadsheet software is best for manual backtesting?
Google Sheets or Microsoft Excel is all you need. Set up simple summary formulas at the top (`AVERAGE` for win rate, `SUM` for total R, `COUNTIF` for total trades).
How do I handle a candle that hits both my stop and my target?
In manual backtesting, always assume the worst: mark it as a loss. In live trading, liquidity spikes usually trigger stop orders before reaching ambitious take-profit targets.
Should I include screenshots in my backtest log?
Including a chart image link for every trade is helpful during the first 20 trades to calibrate your eyes. Beyond that, concise text tags and price coordinates are far faster and keep your spreadsheet responsive.