
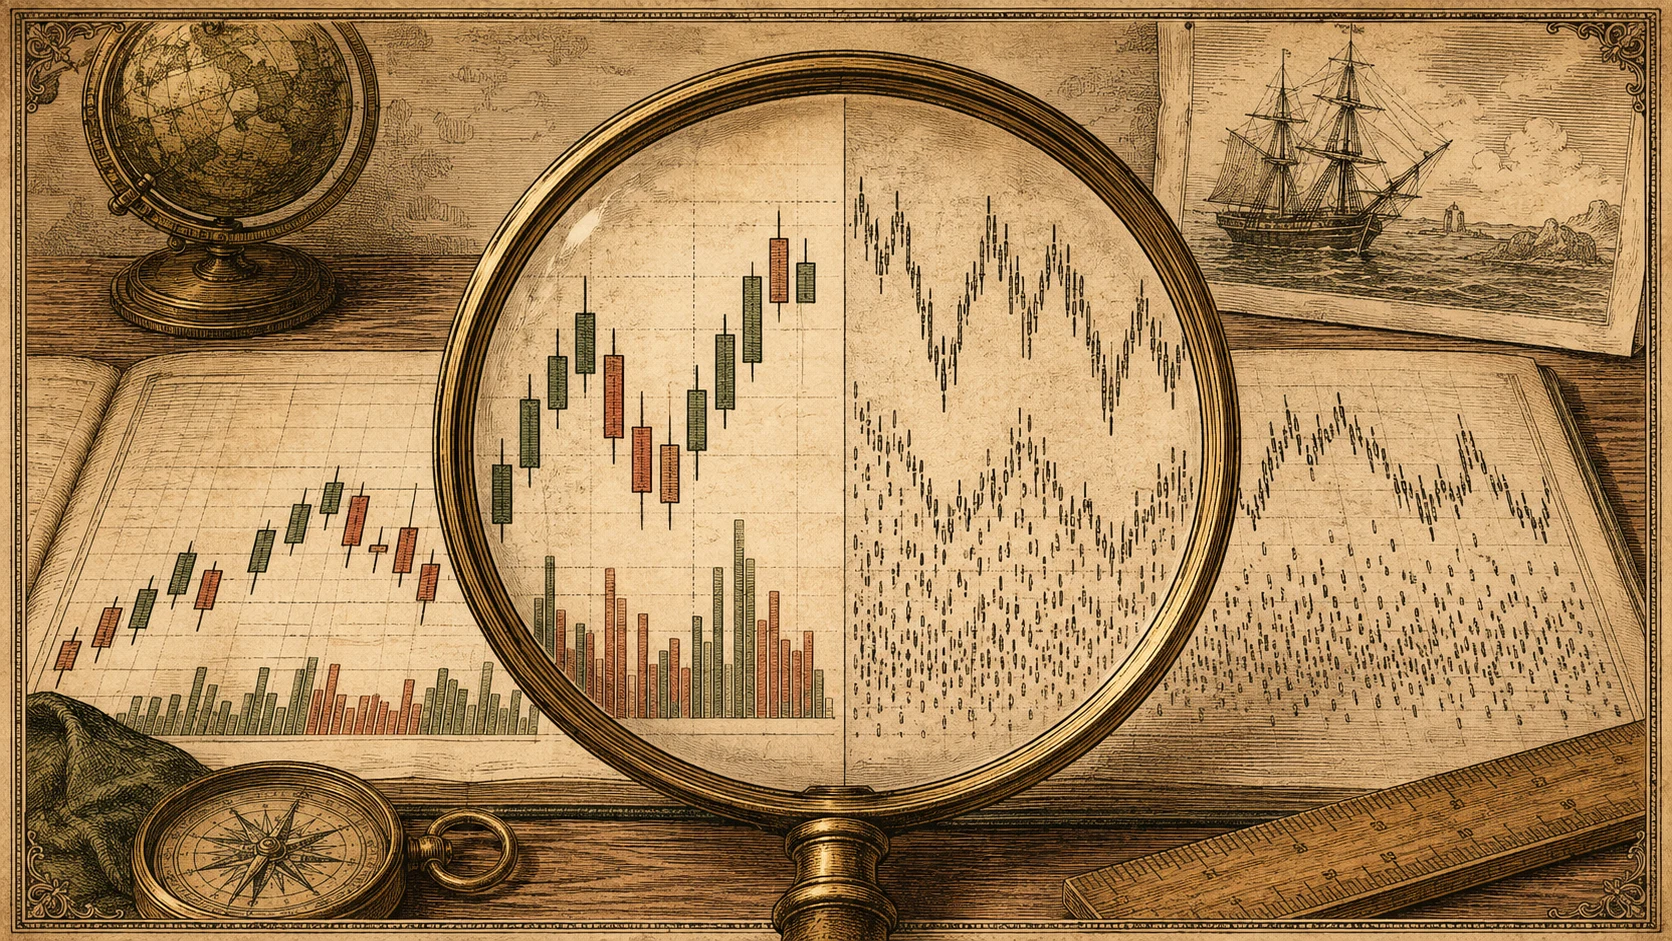
When you first start researching systematic trading, downloading historical data seems straightforward. But you quickly hit a fork in the road: should you download OHLCV candlestick bars, or do you need raw tick data?
A single year of daily candlestick data for an index ETF like SPY fits in an email attachment of just a few kilobytes. In contrast, a single year of raw tick data for an active stock or futures contract captures tens of millions of executions, demanding gigabytes of storage and specialized processing tools.
Using the wrong data type either blinds your research to execution reality or drowns you in unnecessary complexity. Here is how OHLCV and tick data actually differ.
OHLCV data aggregates market activity over a fixed time interval (e.g., 1 minute, 1 hour, or 1 day) into five summary values: Open, High, Low, Close, and Volume. It discards intrabar path information in exchange for compact storage and rapid backtesting. Tick data records individual market events—distinguishing executed trade ticks (timestamp, price, size, conditions) from quote ticks (best bid/ask) and multi-level order-book updates. Pure trade ticks show execution facts and volume, but spread analysis requires quote data and depth analysis requires order-book updates. Tick data is essential for execution microstructure, but is unnecessary for most swing and trend strategies.
| Dimension | OHLCV Bar Data | Granular Tick Data |
|---|---|---|
| Data Nature | Time-bucketed summary (5 metrics per interval) | Event-driven raw stream (every execution logged) |
| Intrabar Path | Hidden (cannot see whether High or Low hit first) | Complete sequence visible with sub-second timestamps |
| File Size / Volume | Extremely lightweight (Megabytes per decade) | Can be substantial (hundreds of MBs to multiple GBs depending on instrument activity and fields) |
| Spread & Book Depth | Completely absent (assumes flat transaction prices) | Trade ticks show executed trades; spread analysis requires quote ticks, and full depth requires order-book updates |
| Best Use Cases | Swing trading, daily trend systems, multi-year factor backtests | Slippage modeling, high-frequency execution, order flow analysis |
The Intrabar Path Problem in Backtesting
The biggest risk of relying solely on OHLCV data is the intrabar sequence blind spot.
Suppose you test a breakout strategy on 1-hour candles where your take-profit is set at +2% and your stop-loss is set at -1%. During a volatile hour, the candle registers a High of +3% and a Low of -1.5%.
Looking only at the OHLCV summary, your backtester cannot know whether the price hit your stop-loss first and knocked you out, or reached your profit target first. Standard software frequently assumes the optimistic outcome, artificially inflating hypothetical backtest win rates.
• Holding days to months: Daily or 4-hour OHLCV data is more than sufficient.
• Holding hours to a full day: 1-minute to 5-minute OHLCV data resolves most intrabar sequence issues.
• Holding seconds to minutes (Scalping): Raw tick data or top-of-book quote data is mandatory to model real bid-ask spread costs.
When Do You Actually Need Tick Data?
Most retail traders never need to store tick data, but three specific research areas require it:
- 11. Realistic Slippage and Liquidity Auditing: Measuring how much price moved against an order when crossing the spread during volatile market opens or news announcements.
- 22. Order Flow & Volume Delta: Pairing trade ticks with prevailing quote ticks to classify buyer-initiated volume (trades hitting the ask) vs. seller-initiated volume (trades hitting the bid) to assess institutional aggression.
- 33. True Execution Simulation: Validating stop-market fill assumptions in fast-moving conditions where prices gap between subsequent trades.
Frequently Asked Questions
What does OHLCV stand for?
OHLCV stands for Open, High, Low, Close, and Volume—the five foundational data points that define a standard candlestick bar.
Can you convert tick data into OHLCV data?
Yes. Tick data is the parent data set; you can aggregate ticks into 1-minute, 5-minute, or daily OHLCV bars. However, you cannot reverse the process: once tick data is aggregated into OHLCV, the granular event sequence is permanently lost.
Is 1-second OHLCV a good alternative to tick data?
1-second OHLCV provides a practical middle ground. It resolves almost all intrabar sequence ambiguities for retail backtesting while keeping file formats tabular and standard.