
Most independent traders conduct research in a flurry of messy tabs, undocumented Python scripts, and hastily saved spreadsheet charts. When a backtest looks fantastic, they celebrate; when it fails, they tweak a parameter and try again.
Three months later, they find themselves asking: 'Which CSV file did I run this on? Did I deduct commissions? How many parameters did I test before finding this winning combination?'
Without structured documentation, trading research is not research—it is random data exploration vulnerable to severe curve-fitting. Here is a lightweight, battle-tested 8-part research notebook template you can immediately adopt in Markdown, Jupyter, or Notion.
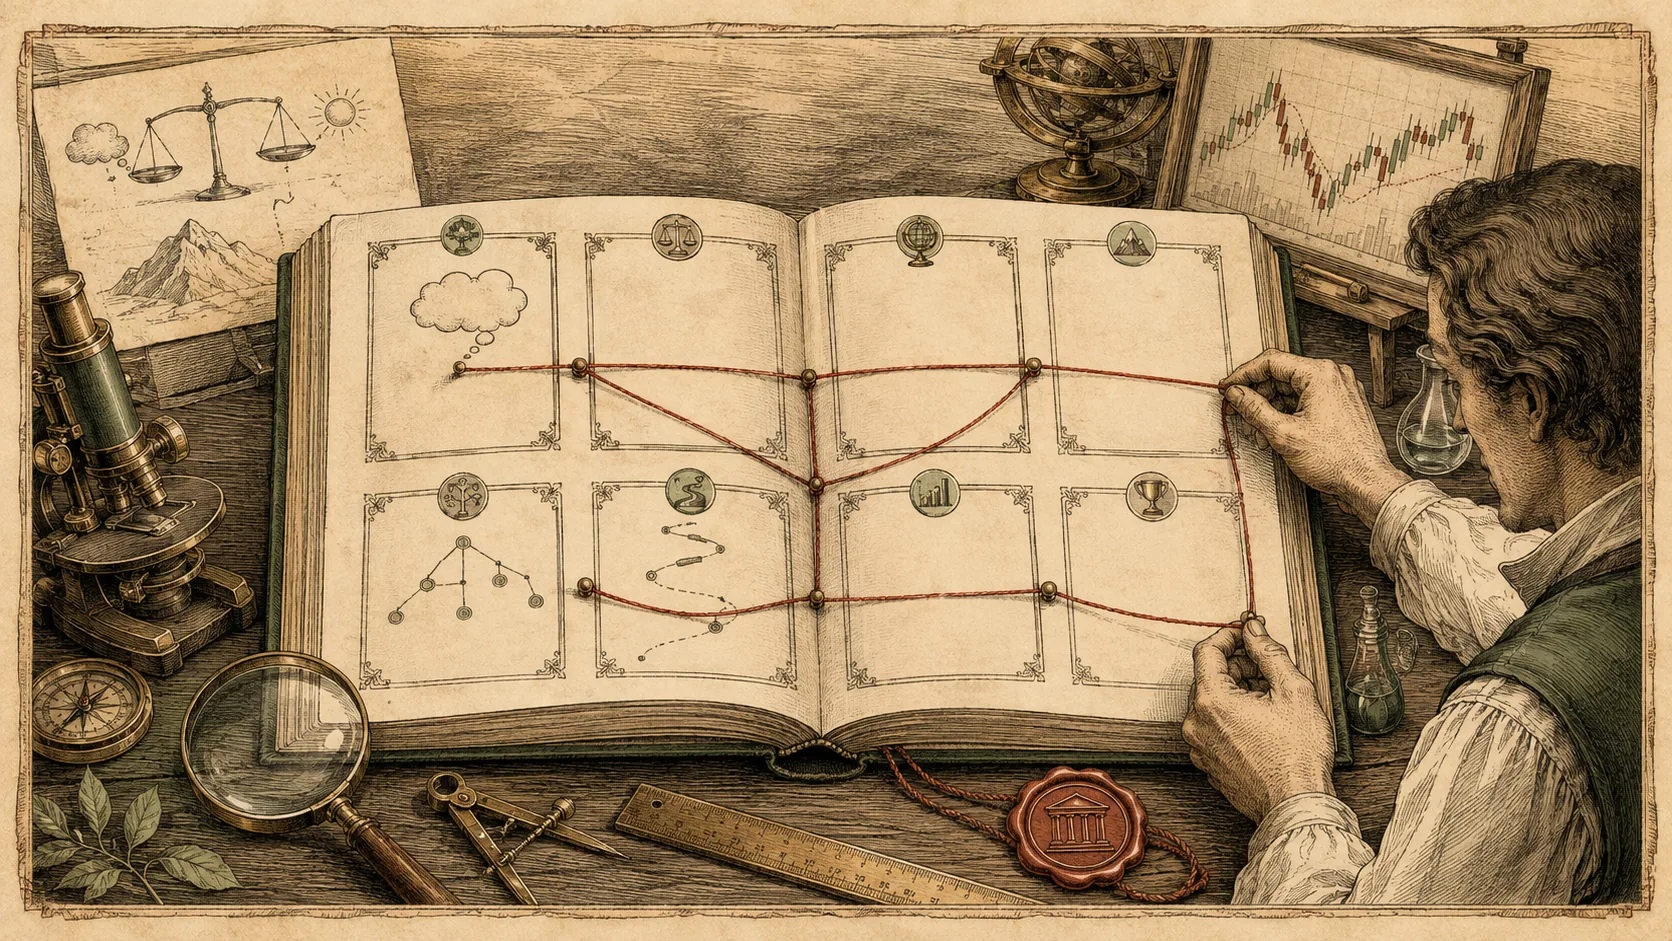
An auditable Trading Research Notebook documents the entire evolution of an idea before and after running code. Instead of recording only final performance curves, it captures 8 essential fields: (1) Research Question, (2) Economic Hypothesis, (3) Data & Universe, (4) Execution Assumptions, (5) Parameters & Search Count, (6) In-Sample vs Out-of-Sample Results, (7) Known Limitations, and (8) Next Follow-up Test. Documenting this workflow protects you from fooling yourself with overfitted noise.
| Section | Core Purpose | Practical Example Input |
|---|---|---|
| 1. Research Question | What specific empirical question are you investigating? | 'Does buying 20-day breakout highs in liquid tech stocks yield a post-cost edge?' |
| 2. Hypothesis | What economic or behavioral logic explains why this edge should exist? | 'Institutional execution programs take multiple days to accumulate, creating momentum autocorrelation.' |
| 3. Data & Universe | What exact assets, timeframes, and vendor versions were used? | 'Nasdaq 100 daily OHLCV, 2015-2024, split/dividend adjusted, vendor API snapshot 2026-09-01.' |
| 4. Assumptions | What frictions are modeled? | '$0.005/share commission, 2 bps slippage on open, no short borrow constraints.' |
| 5. Parameters Tested | What parameters were tested and how many variations were rejected? | 'Lookback: 20 days. Tested 10, 20, 50 (3 variations total, 2 discarded due to drawdown).' |
| 6. Out-of-Sample Result | Did performance hold up on untouched historical or forward paper data? | 'In-sample Sharpe: 1.45 (2015-2021); Out-of-sample Sharpe: 1.10 (2022-2024).' |
| 7. Known Limitations | Where is this model guaranteed to struggle or break down? | 'Severe underperformance during choppy sideways regimes; does not model intraday circuit breakers.' |
| 8. Next Steps | What is the single subsequent falsification test to run? | 'Stress-test against 2008 financial crisis data to observe maximum liquidity drawdown.' |
- Write the Hypothesis Before Touching the Code: If you look at the price chart first and invent a rationale second, you are curve-fitting. Pre-register your thesis in writing.
- Log Failed Experiments Religiously: Tracking rejected parameter combinations is critical for evaluating statistical significance. Testing dozens or hundreds of parameter variations greatly raises data-snooping and curve-fitting risk, increasing the likelihood that an apparent winner is merely random noise.
- Lock Data Versions in Place: Always reference immutable dataset snapshots. Never run a backtest on an unversioned live database query that can silently change tomorrow.
- Keep It Lean: A good research log takes 5 minutes to complete. If your documentation process feels like writing an academic dissertation, you will quickly abandon it.
Frequently Asked Questions
Do discretionary manual traders really need a research notebook?
Yes. Discretionary traders who backtest setups manually on historical charts need a research notebook even more than quants, because manual review is intensely prone to confirmation bias and hindsight cherry-picking.
What tool should I use to maintain this research notebook?
The best tool is whichever you will consistently use. Plain text Markdown files committed to a private Git repository alongside your code are ideal, but Obsidian, Notion, or structured Jupyter notebooks work equally well.
How often should I review my historical research logs?
Review your notebook quarterly. Comparing what you predicted in Section 2 with what actually occurred in live execution reveals your personal cognitive biases faster than any book on trading psychology.