
Where it stands
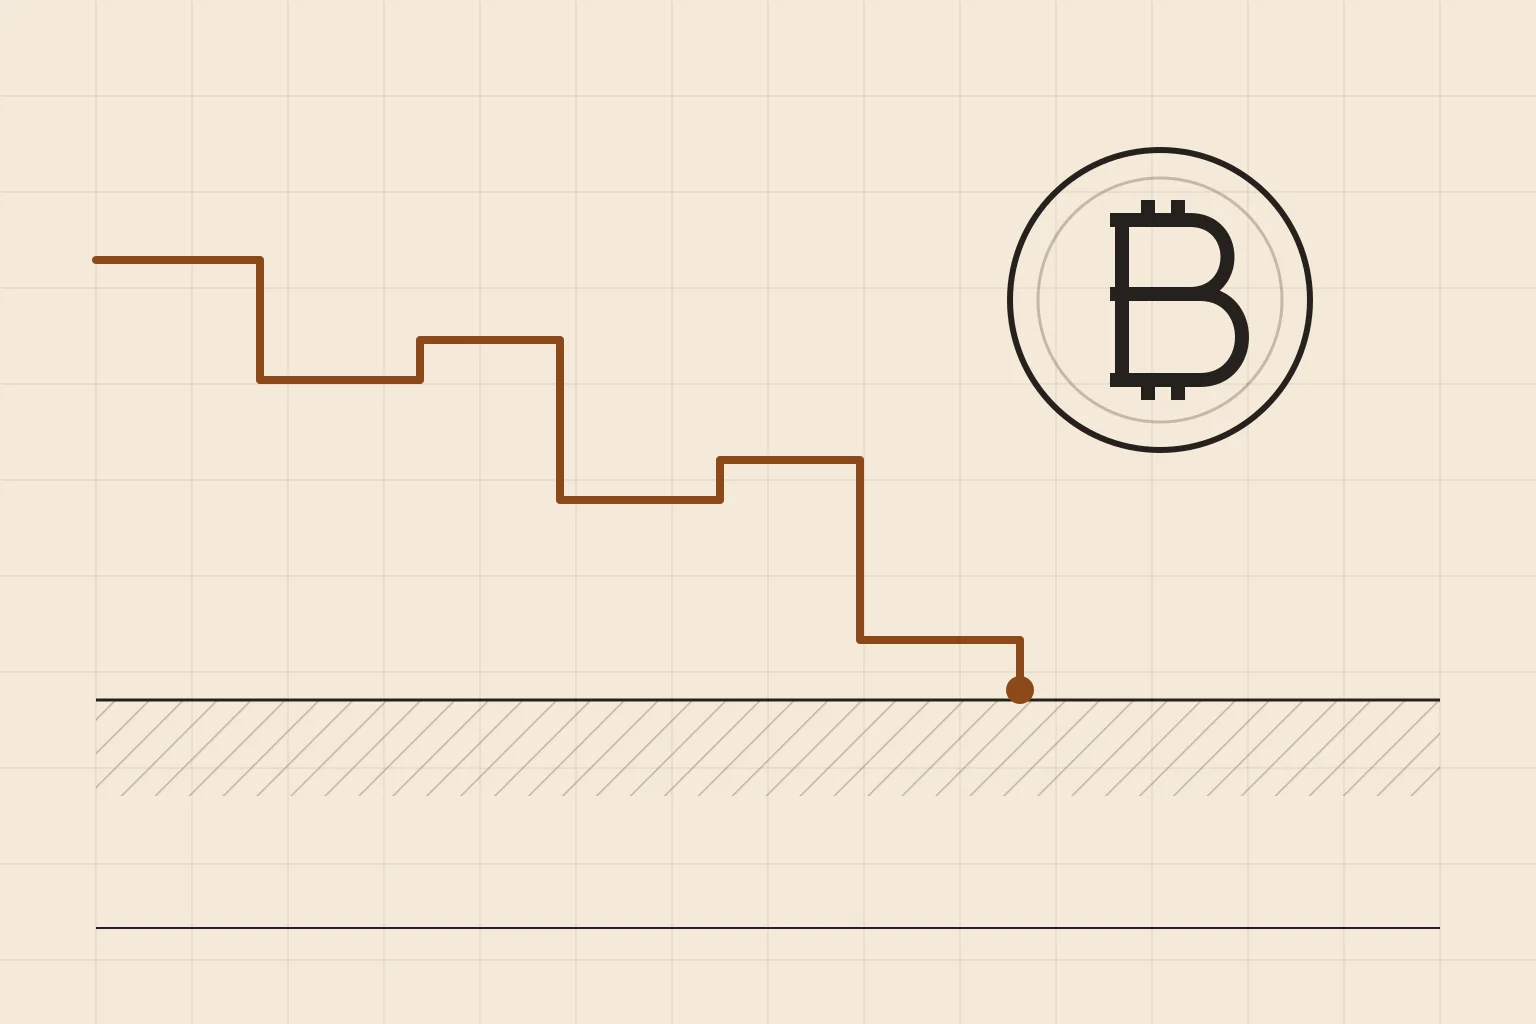
Bitcoin is shedding borrowed money
~$82,300
Bitcoin
Near its lowest this month; about -4% on the week
-$485M
US spot bitcoin ETF flows, Oct 7
Largest daily outflow since June
>$500M
Leveraged longs force-closed
Estimates vary by data provider
5.22%
10-year Treasury yield
5.31% on Oct 5, highest since 2002
A hen that lays no eggs, bought on credit
Bitcoin is often described as a hedge against the old financial system, so a week of hawkish Fed news should not matter much. It mattered a lot. The Fed minutes on October 7 confirmed that most officials expect another rate hike by year-end, and the same day US spot bitcoin ETFs saw their largest single-day outflow since June.
Like gold, bitcoin pays no income. Its price depends partly on what safe alternatives pay, and the 10-year Treasury now pays about 5.2%, the most since 2002. The difference is how bitcoin is held. A large share of trading runs on borrowed money: futures and perpetual contracts that let a trader control $10 of bitcoin with $1 of their own.
That turns a slow pressure into a sudden one. When the price drops far enough, the exchange closes the borrowed position whether the trader wants to sell or not, and that sale pushes the price down to the next cluster of borrowers. This week more than half a billion dollars of long positions were closed that way. Leverage does not decide where bitcoin goes; it decides how fast it gets there.
Higher rates also raise the cost of holding any position on credit. That is why a Fed that keeps hiking weighs on bitcoin twice: once through the egg next door, and again through the price of borrowing.
Drivers
What moves bitcoin this week
| Driver | Where it is | What it means for bitcoin |
|---|---|---|
| US CPI for September · Wed | Consensus ~3.7% y/y; core ~2.4% | A hot core reading firms the December hike and keeps yields high. A soft one is the most direct route to a relief rally. |
| Spot ETF flows | -$485M on Oct 7, erasing the prior day's inflow | ETF holders pay cash, not credit. Two or three days of inflows would show the patient buyers are back. |
| Leverage | Heavy long liquidations near $82,000–$83,000 | Some forced selling is already done. Analysts flag $80,000 as the next liquidation zone; we have no public liquidation map to confirm it, so we treat it as a watch level. |
| 10-year yield and the dollar | 5.22%; dollar near its strongest since June | The background pressure on every rebound: a rally that happens while yields climb has little underneath it. |
You've reached the end of the free preview
Premium Research
Read the full research.
Go deeper into this analysis with MyTrade Pro. One membership includes every research edition and the full interactive learning experience.
Continue with these sections
- Our call
- Three ways the week can go
- Our base case
A one-time allowance of 3 full articles with a free account.
Sources
- Farside InvestorsBitcoin ETF flow data
- crypto.newsBitcoin ETFs post biggest outflow since June, can BTC price hold $82K?
- CoinDeskBitcoin price
- Federal ReserveMinutes of the FOMC, September 15–16, 2026
- U.S. TreasuryDaily Treasury par yield curve rates, October 2026
See 1 more sources
- U.S. Bureau of Labor StatisticsCPI release schedule